Introduction
In today’s dynamic cloud environments, detecting and mitigating network scans is crucial for ensuring the security and health of your infrastructure. Azure provides robust tools like VNet Flow Logs, Log Analytics, and custom KQL (Kusto Query Language) rules that can help you detect and respond to both horizontal and vertical network scans. In this post, we will dive into how you can leverage these tools to build effective detection mechanisms for network scans in Azure. We will cover key concepts like VNet flow logs, network architecture best practices, and provide step-by-step guidance on creating custom KQL queries to identify scanning activities in your environment. Whether you’re an Azure security enthusiast or a network administrator, this guide will empower you to enhance your cloud network monitoring..
VNet flow logs
Virtual network flow logs became generally available 9 months ago. With the help of VNet flow logging, we can now generate NetFlow/IPFIX-style logs. Virtual network flow logs enable the detection of security vulnerabilities and assist in threat-hunting investigations by providing a complete trail of user and application activity. Previously, network security group (NSG) flow logs were used, but they were cumbersome. On September 30, 2027, NSG flow logs will be retired. As part of this retirement, you will no longer be able to create new NSG flow logs starting June 30, 2025.
Using Virtual Network Flow Logs to monitor traffic is a game-changer for network security and performance management. These tools provide invaluable insights into traffic behavior, enabling you to identify patterns and deviations that could indicate potential security compromises. By leveraging these capabilities, you can proactively address threats before they escalate, ensuring your network remains secure.
Network Architecture
Before we dive into the subject, I want to first discuss Hub and Spoke networks to clarify our journey. If this topology is already familiar to you, feel free to skip this section.
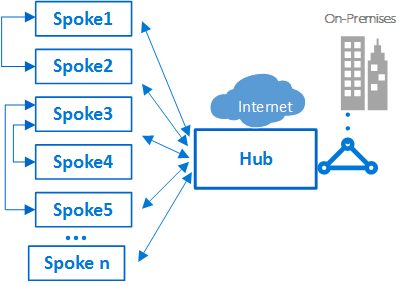
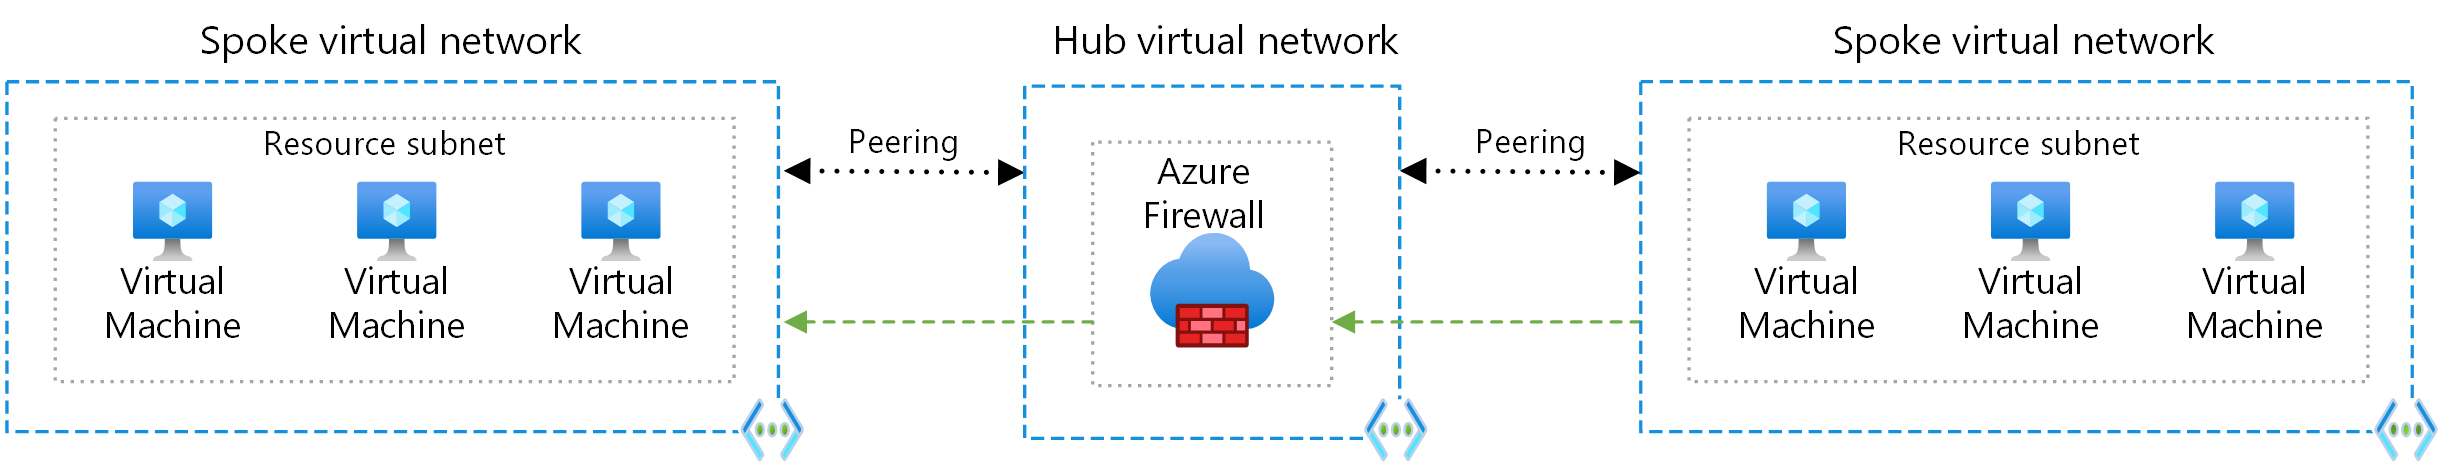
A hub is a central network zone that controls and inspects ingress and egress traffic between zones: the internet, on-premises, and spokes. The hub-and-spoke topology provides your IT department with an effective way to enforce security policies in a central location. It also reduces the potential for misconfiguration and exposure.
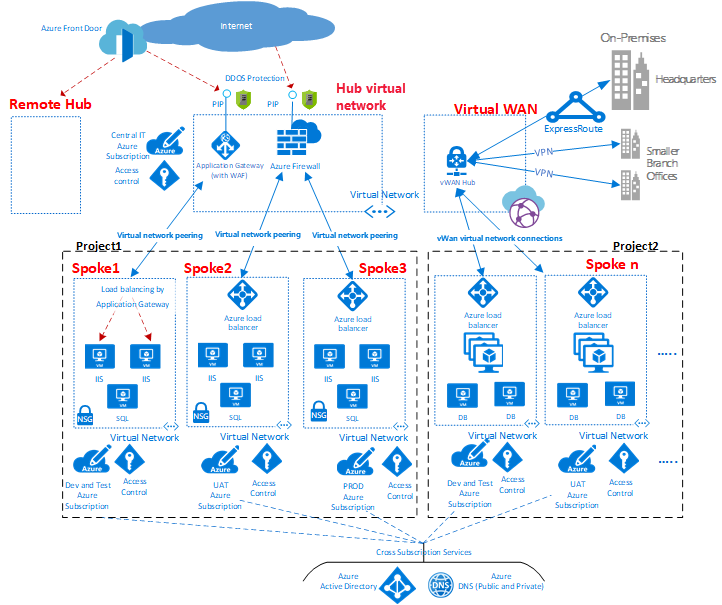
As shown in the diagram, Azure supports two types of hub-and-spoke designs:
- The first type supports communication, shared resources, and centralized security policies. This is labeled as the VNet hub in the diagram.
- The second type is based on Azure Virtual WAN and is labeled as Virtual WAN in the diagram. This type is designed for large-scale branch-to-branch and branch-to-Azure communications.
be careful interconnecting between spokes
A typical example of this scenario is the case where application processing servers are in one spoke or virtual network. The database deploys in a different spoke or virtual network. In this case, it’s easy to interconnect the spokes with virtual network peering and avoid transiting through the hub. Do a careful architecture and security review to ensure that bypassing the hub doesn’t bypass important security or auditing points that are only in the hub.
The benefits of using a hub and spoke configuration include
The benefits of using a hub and spoke configuration include:
- Cost savings
- Overcoming subscription limits
- Workload isolation For more information, see Hub-and-spoke network topology.
When you peer virtual networks in different subscriptions, you can associate the subscriptions to the same or different Microsoft Entra tenants. This flexibility allows for decentralized management of each workload while maintaining shared services in the hub.
Potential use cases
Typical uses for a hub and spoke architecture include workloads that:
- Have several environments that require shared services. For example, a workload might have development, testing, and production environments. Shared services might include DNS IDs, Network Time Protocol (NTP), or Active Directory Domain Services (AD DS). Shared services are placed in the hub virtual network, and each environment deploys to a different spoke to maintain isolation.
- Don’t require connectivity to each other, but require access to shared services.
- Require central control over security, like a perimeter network (also known as DMZ) firewall in the hub with segregated workload management in each spoke.
- Require central control over connectivity, such as selective connectivity or isolation between spokes of certain environments or workloads.
Recommendations
As a general rule, it’s best to have at least one hub per region. This configuration helps avoid a single point of failure, for example to avoid Region A resources being affected at the network level by an outage in Region B.
GatewaySubnet
The virtual network gateway requires GatewaySubnet. You can also use a hub-spoke topology without a gateway if you don’t need cross-premises network connectivity. Create a subnet named GatewaySubnet with an address range of at least /27. The /27 address range gives the subnet enough scalability configuration options to prevent reaching the gateway size limitations in the future.
AzureFirewallSubnet
Create a subnet named AzureFirewallSubnet with an address range of at least /26. Regardless of scale, the /26 address range is the recommended size and covers any future size limitations. This subnet doesn’t support network security groups (NSGs).
Communication through an NVA
Communication via an NVA like a firewall and router. This method incurs a hop between the two spokes. If you need connectivity between spokes, consider deploying Azure Firewall or another NVA in the hub. Then create routes to forward traffic from a spoke to the firewall or NVA, which can then route to the second spoke. In this scenario, you must configure the peering connections to allow forwarded traffic.
Evaluate the services you share in the hub to ensure that the hub scales for a larger number of spokes. For instance, if your hub provides firewall services, consider your firewall solution’s bandwidth limits when you add multiple spokes. You can move some of these shared services to a second level of hubs. The number of virtual network peerings per virtual network is limited. If you have many spokes that need to connect with each other, you could run out of peering connections. Connected groups also have limitations. In this scenario, consider using user-defined routes (UDRs) to force spoke traffic to be sent to Azure Firewall or another NVA that acts as a router at the hub. This change allows the spokes to connect to each other. To support this configuration, you must implement Azure Firewall with forced tunnel configuration enabled. The topology in this architectural design facilitates egress flows. While Azure Firewall is primarily for egress security, it can also be an ingress point, but not recommended.
To configure spokes to communicate with remote networks through a hub gateway, you can use virtual network peerings or connected network groups.
To use virtual network peerings, in the virtual network Peering setup:
- Configure the peering connection in the hub to Allow gateway transit.
- Configure the peering connection in each spoke to Use the remote virtual network’s gateway.
- Configure all peering connections to Allow forwarded traffic.
To use connected network groups:
- In Virtual Network Manager, create a network group and add member virtual networks.
- Create a hub and spoke connectivity configuration.
- For the Spoke network groups, select Hub as gateway.
Next steps
The hub in a hub-spoke network topology is the main component of a connectivity subscription in an Azure landing zone. For more information about building large-scale networks in Azure with routing and security managed by the customer or by Microsoft, see Define an Azure network topology.
Enable vnet flow logging
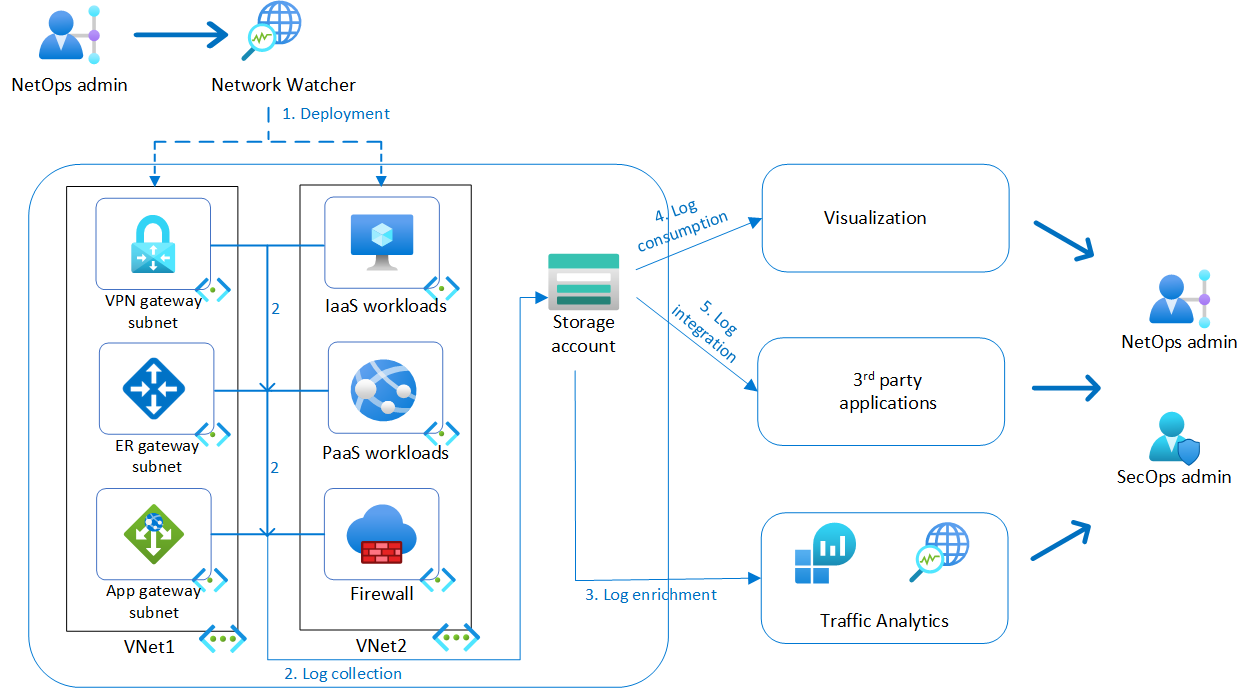
Virtual network flow logging is a feature of Azure Network Watcher that allows you to log information about IP traffic flowing through an Azure virtual network.
Register Insights provider
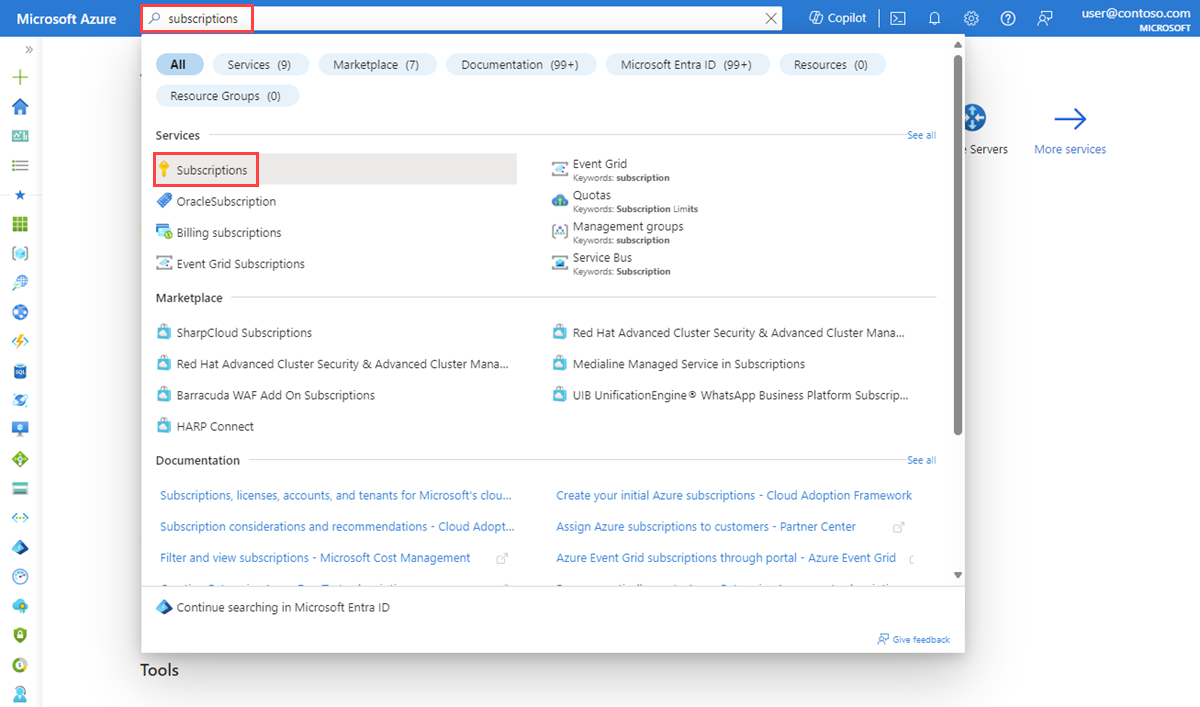
Microsoft.Insights provider must be registered to successfully log traffic flowing through a virtual network. If you aren’t sure if the Microsoft. Insights provider is registered, check its status in the Azure portal by following these steps:
- In the search box at the top of the portal, enter subscriptions. Select Subscriptions from the search results.
Select the Azure subscription that you want to enable the provider for in Subscriptions.
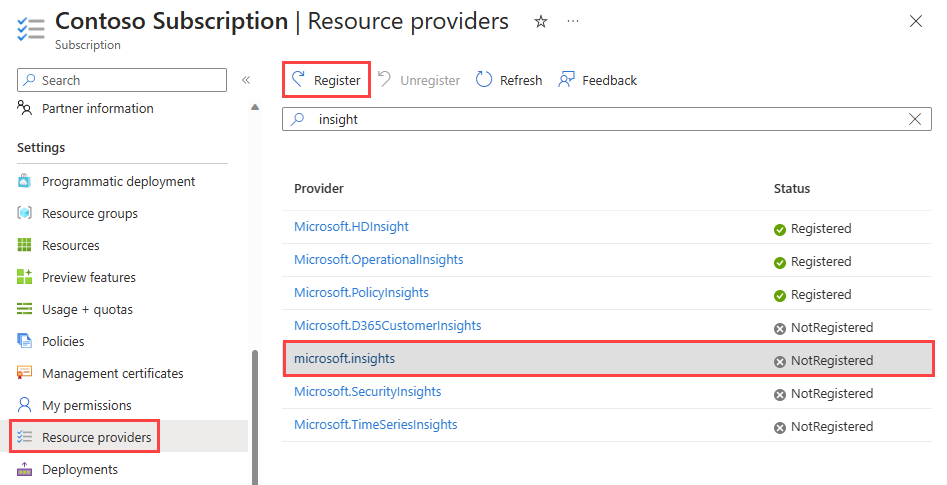
Under Settings, select Resource providers.
Enter insight in the filter box.
Confirm the status of the provider displayed is Registered. If the status is NotRegistered, select the Microsoft.Insights provider then select Register.
Create a flow log
Create a flow log for your virtual network, subnet, or network interface. This flow log is saved in an Azure storage account.
In the search box at the top of the portal, enter network watcher. Select Network Watcher from the search results.
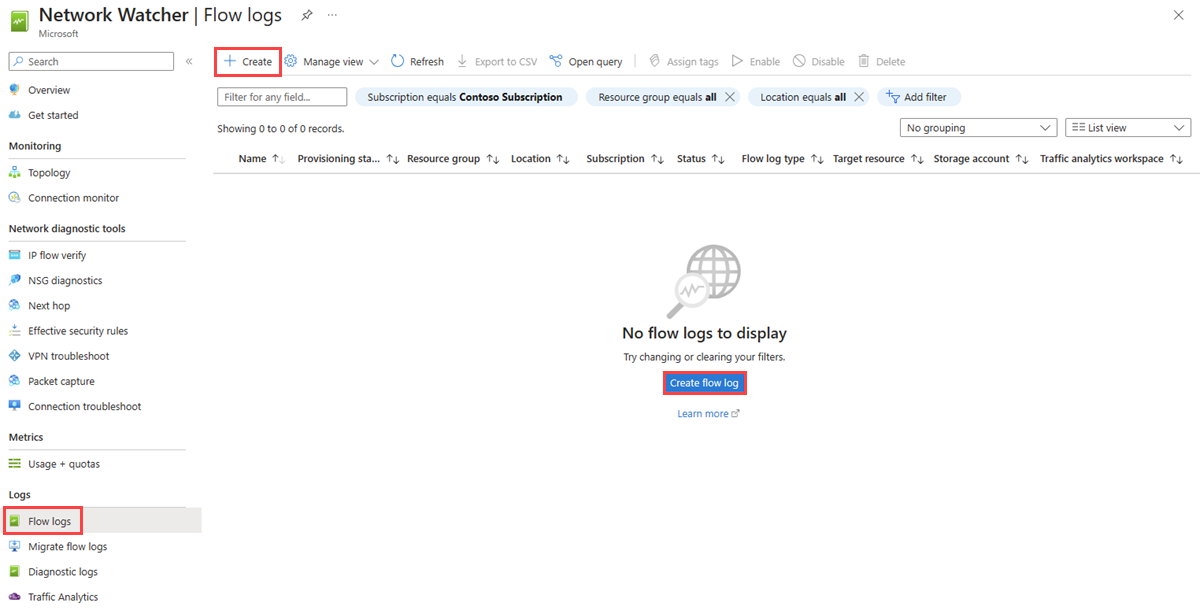
Under Logs, select Flow logs.
In Network Watcher | Flow logs, select + Create or Create flow log blue button.
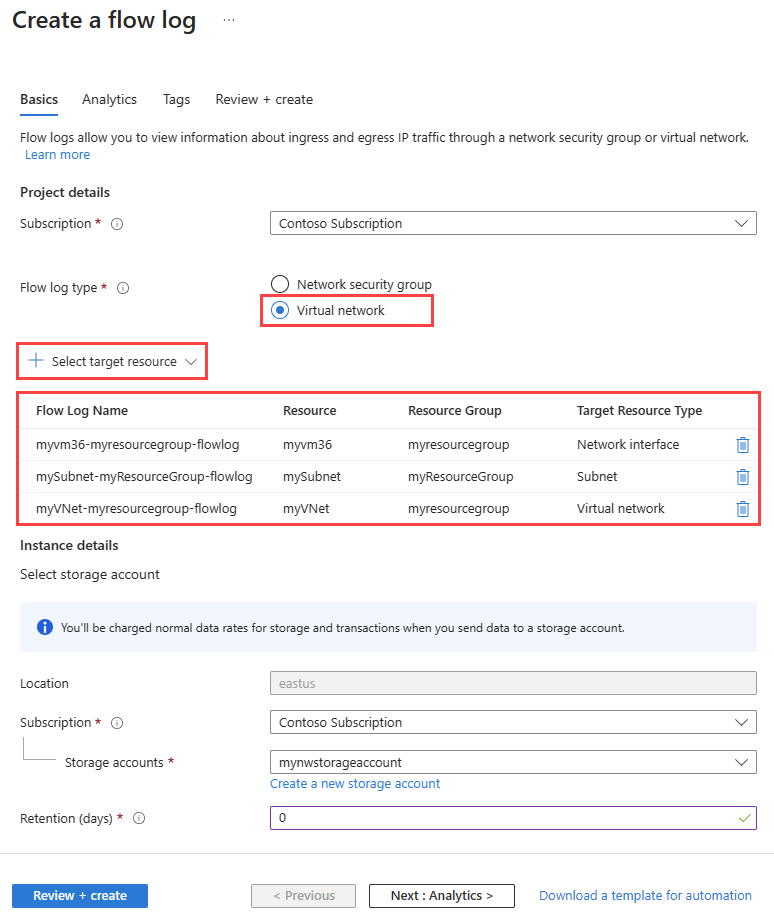
- On the Basics tab of Create a flow log, enter or select the following values:
| Setting | Value |
|---|---|
| Project details | |
| Subscription | Select the Azure subscription of your virtual network that you want to log. |
| Flow log type | Select Virtual network then select + Select target resource (available options are: Virtual network, Subnet, and Network interface). Select the resources that you want to flow log, then select Confirm selection. |
| Flow Log Name | Enter a name for the flow log or leave the default name. Azure portal uses {ResourceName}-{ResourceGroupName}-flowlog as a default name for the flow log. |
| Instance details | |
| Subscription | Select the Azure subscription of the storage account. |
| Storage accounts | Select the storage account that you want to save the flow logs to. If you want to create a new storage account, select Create a new storage account. |
| Retention (days) | Enter a retention time for the logs (this option is only available with Standard general-purpose v2 storage accounts). Enter 0 if you want to retain the flow logs data in the storage account forever (until you manually delete it from the storage account). For information about pricing, see Azure Storage pricing. |
If the storage account is in a different subscription, the resource that you’re logging (virtual network, subnet, or network interface) and the storage account must be associated with the same Microsoft Entra tenant. The account you use for each subscription must have the necessary permissions.
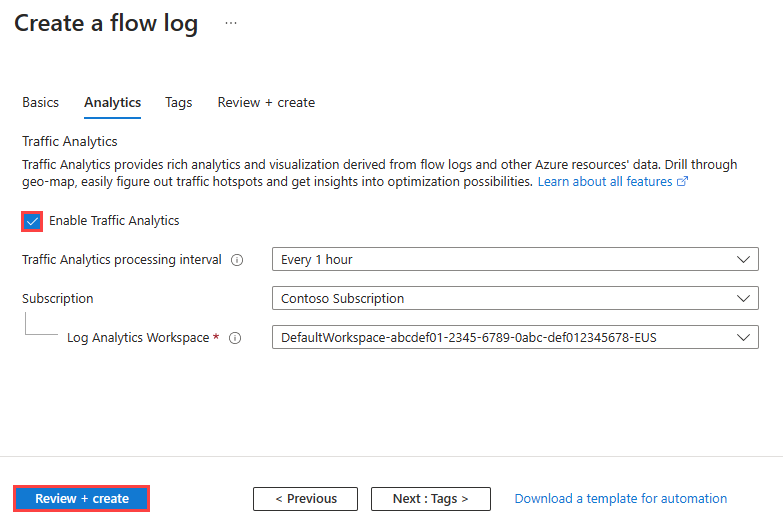
- To enable traffic analytics, select Next: Analytics button, or select the Analytics tab. Enter or select the following values:
| Setting | Value |
|---|---|
| Enable traffic analytics | Select the checkbox to enable traffic analytics for your flow log. |
| Traffic analytics processing interval | Select the processing interval that you prefer, available options are: Every 1 hour and Every 10 mins. The default processing interval is every one hour. For more information, see Traffic analytics. |
| Subscription | Select the Azure subscription of your Log Analytics workspace. |
| Log Analytics Workspace | Select your Log Analytics workspace. By default, Azure portal creates DefaultWorkspace-{SubscriptionID}-{Region} Log Analytics workspace in defaultresourcegroup-{Region} resource group. |
To create and select a Log Analytics workspace other than the default one, see Create a Log Analytics workspace
- Select Review + create.
- Review the settings, and then select Create.
Enable traffic analytics
Enable traffic analytics for a flow log to analyze the flow log data. Traffic analytics provides insights into the traffic patterns of your virtual network. You can enable or disable traffic analytics for a flow log at any time.
To enable traffic analytics for a flow log, follow these steps:
- In the search box at the top of the portal, enter network watcher. Select Network Watcher from the search results.
- Under Logs, select Flow logs.
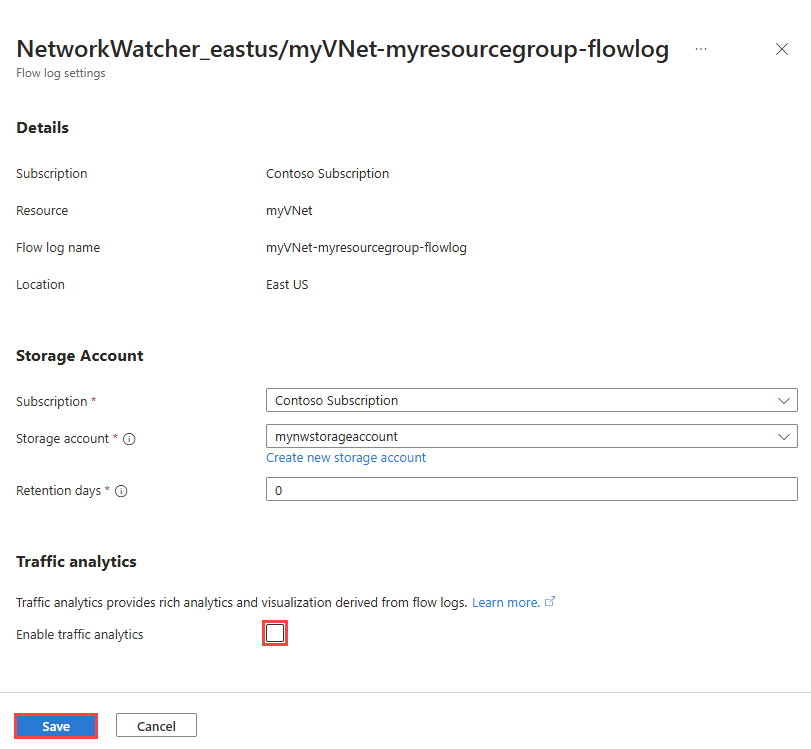
- In Network Watcher | Flow logs, select the flow log that you want to enable traffic analytics for.
- In Flow logs settings, under Traffic analytics, check the Enable traffic analytics checkbox.
- Enter or select the following values:
| Setting | Value |
|---|---|
| Subscription | Select the Azure subscription of your Log Analytics workspace. |
| Log Analytics workspace | Select your Log Analytics workspace. By default, Azure portal creates DefaultWorkspace-{SubscriptionID}-{Region} Log Analytics workspace in defaultresourcegroup-{Region} resource group. |
| Traffic logging interval | Select the processing interval that you prefer, available options are: Every 1 hour and Every 10 mins. The default processing interval is every one hour. For more information, see Traffic analytics. |
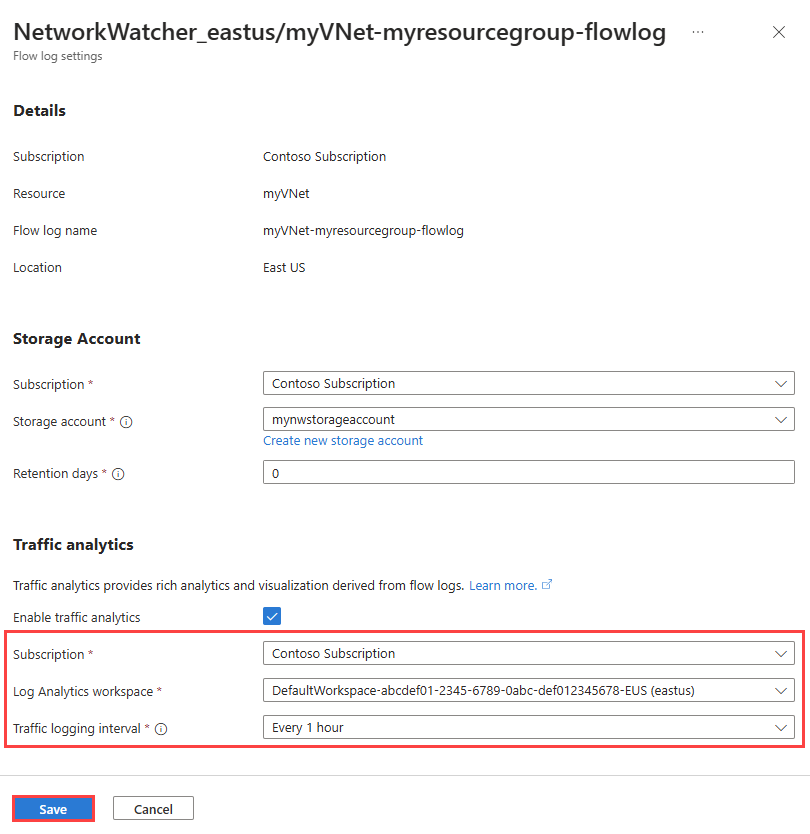
- Select Save to apply the changes.
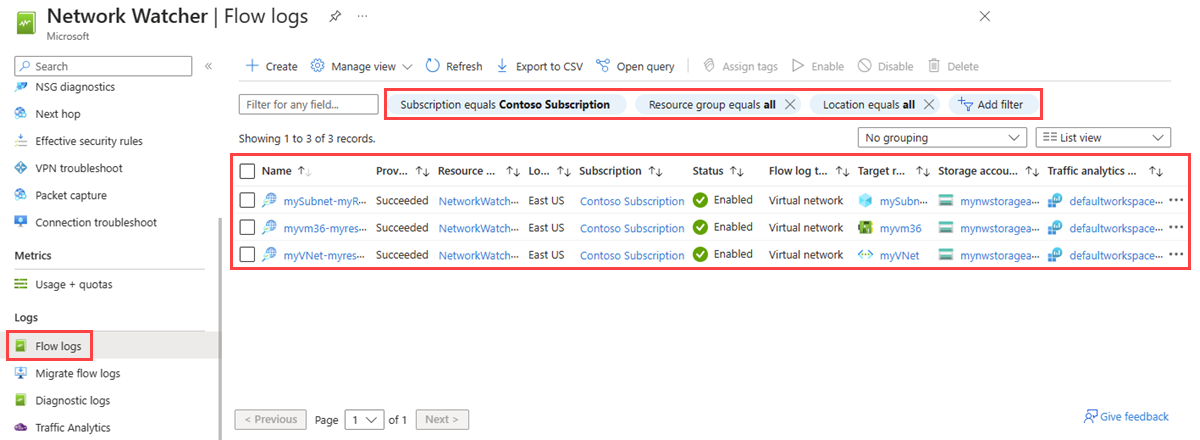
List all flow logs
You can list all flow logs in a subscription or a group of subscriptions. You can also list all flow logs in a region.
- In the search box at the top of the portal, enter network watcher. Select Network Watcher from the search results.
- Under Logs, select Flow logs.
- Select Subscription equals filter to choose one or more of your subscriptions. You can apply other filters like Location equals to list all the flow logs in a region.
Using virtual network flow logs
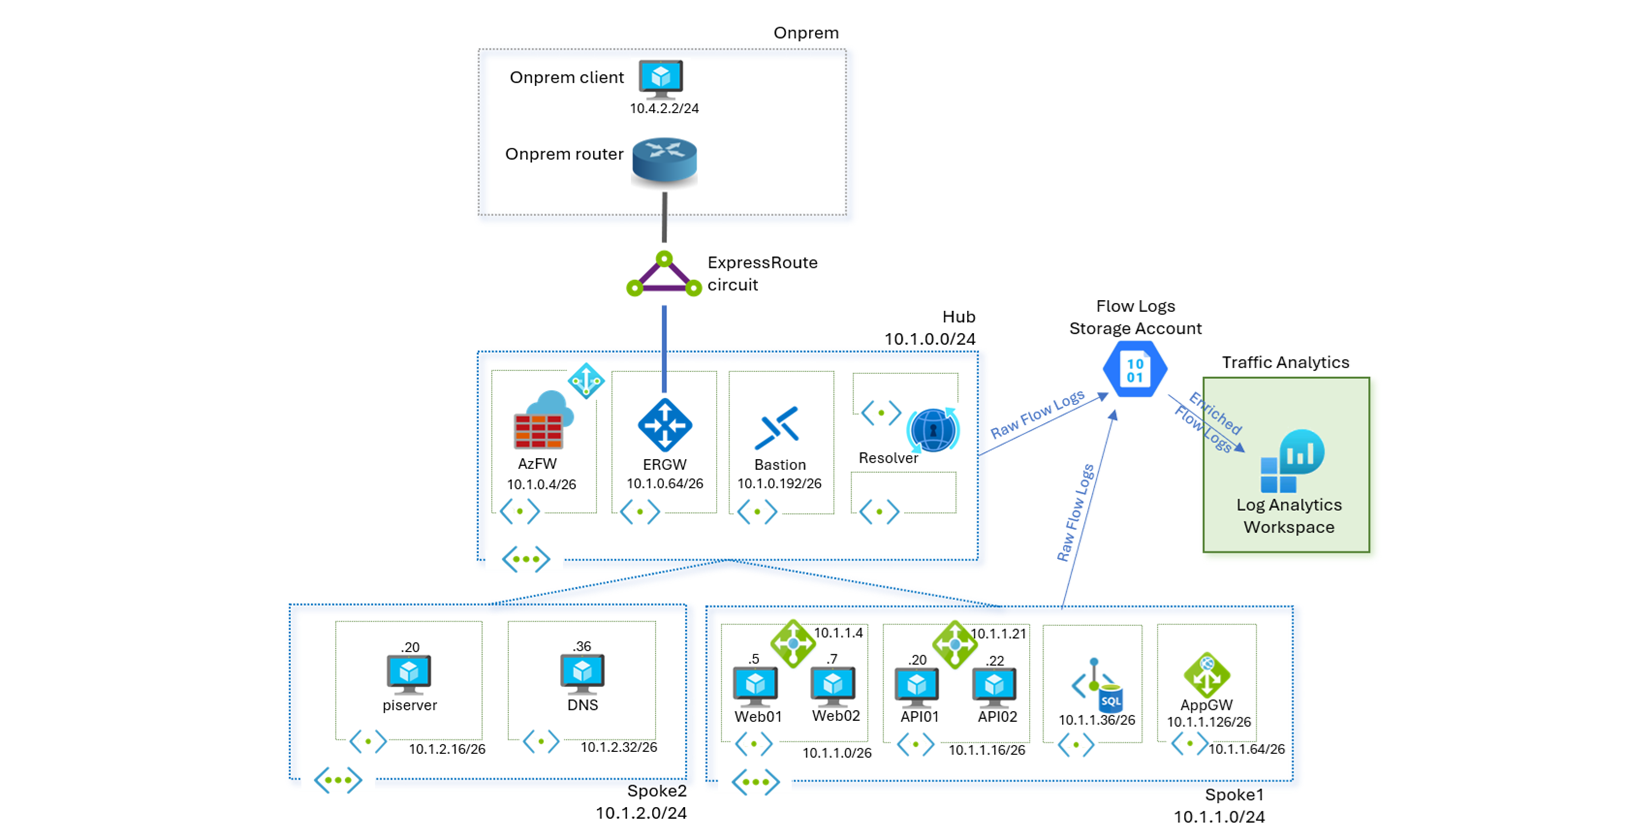
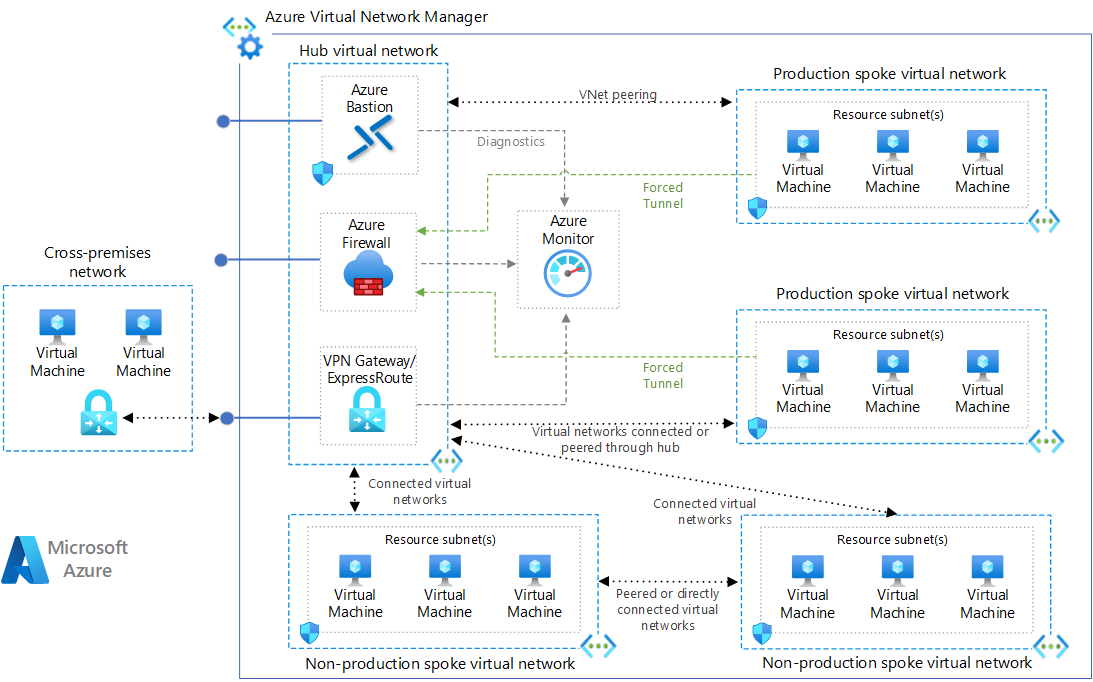
To demonstrate some of the scenarios described above, Azure environment comprising a hub and spoke topology is used, with the hub containing a Firewall, Bastion, DNS Private Resolver, and connectivity to on-premises via ExpressRoute gateway. Spoke1 has a sample application deployed on virtual machines with load balancers fronting each tier, and a private endpoint connected to an SQL Database for the DB tier. Spoke2 has sample workloads to test spoke-to-spoke traffic. Network Watcher virtual network flow logs and Traffic Analytics have been enabled on Hub virtual network.
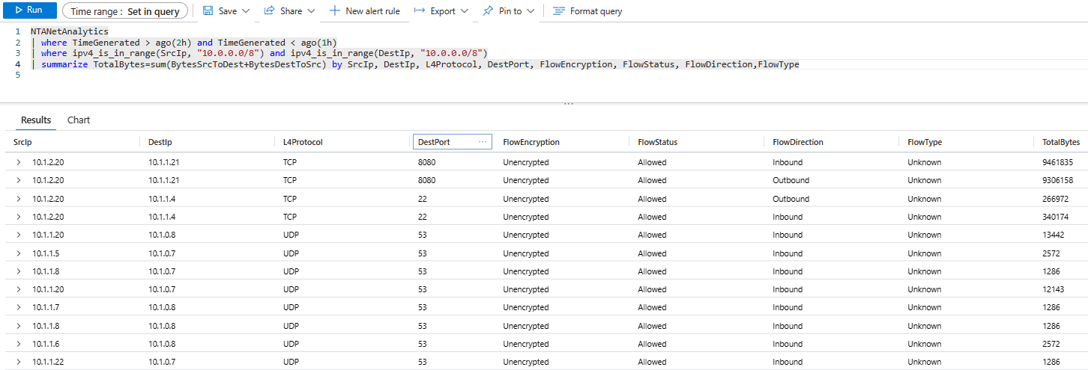
Virtual network flow logs allow optimization of log volume and simplification of management by enabling them at hub virtual network. All traffic flowing through the hub, including spoke-to-spoke traffic is recorded on the hub virtual network. In the topology of demo environment, traffic between the spokes is routed via hub firewall. The example query below aggregates throughput between internal IP addresses for specified ranges. An endpoint on Spoke2 (10.1.2.20) can be seen accessing another API endpoint on Spoke1(10.1.1.21) on port 8080, connecting to Web endpoint on Spoke1(10.1.1.4) via SSH and establishing DNS connectivity with Hub(10.1.0.8) on port 53.
KQL query examples
Before I show you the KQL query for detecting horizontal and vertical scans, I want to share some KQL query examples from different blog posts that might be interesting to you.
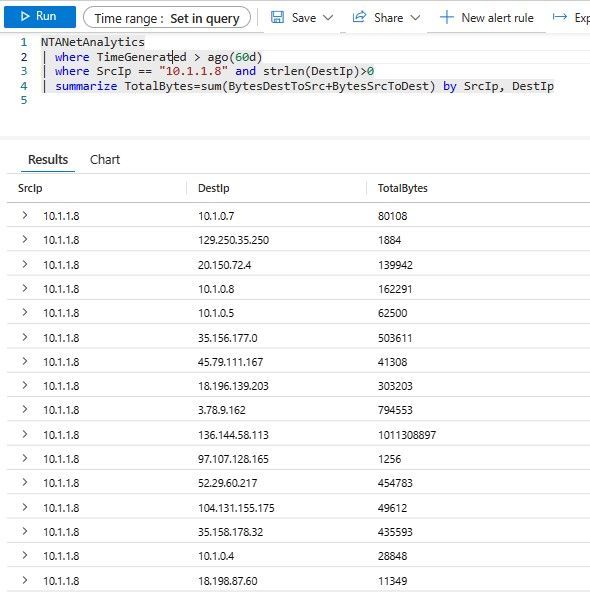
traffic to/from a virtual machine
imagine you want to see with which IP addresses a given virtual machine has been talking to in the last few days
NTANetAnalytics
| where TimeGenerated > ago(60d)
| where SrcIp == "10.1.1.8" and strlen(DestIp)>0
| summarize TotalBytes=sum(BytesDestToSrc+BytesSrcToDest) by SrcIp, DestIp
What if we want to enrich this information with the NTAIpDetails table to get the geolocation of the public IP addresses? Let’s have a look:
NTANetAnalytics
| where TimeGenerated > ago(60d)
| where SrcIp == "10.1.1.8" and strlen(DestIp)>0
| join kind = leftouter (NTAIpDetails) on $left.DestIp == $right.Ip
| summarize TotalBytes=sum(BytesDestToSrc+BytesSrcToDest) by SrcIp, DestIp, PublicIpDetails, Location
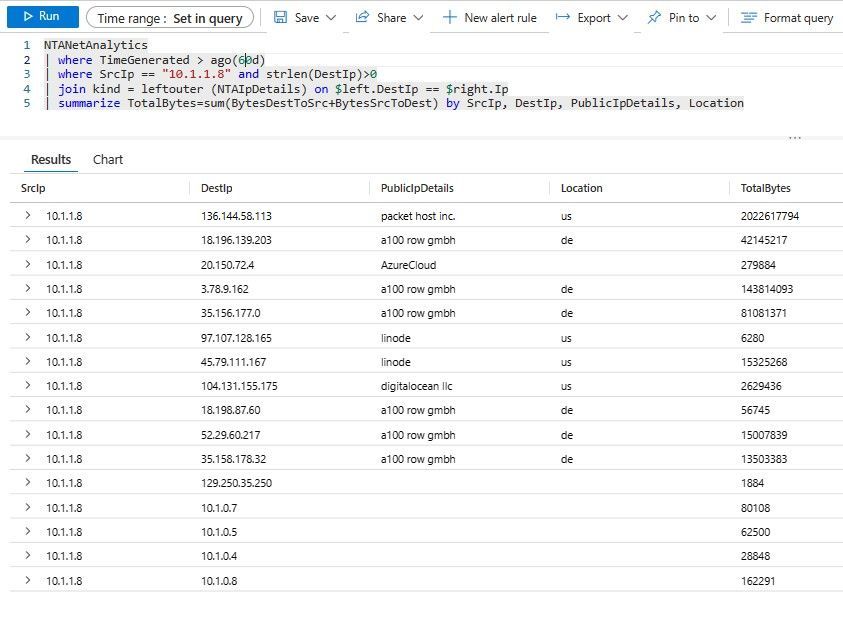
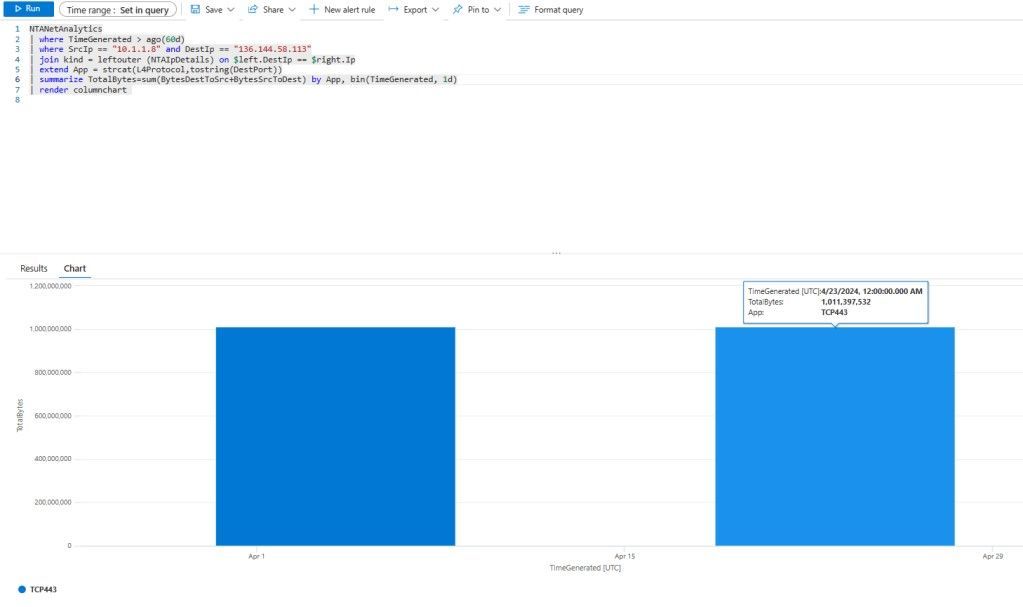
packet host inc. looks suspicious, so now you might be interested in getting a time distribution on the protocols that have been going on there. We can see here that there have been two big data transfers of around 1GB in two different days, the last one on 23rd April.
NTANetAnalytics
| where TimeGenerated > ago(60d)
| where SrcIp == "10.1.1.8" and DestIp == "136.144.58.113"
| join kind = leftouter (NTAIpDetails) on $left.DestIp == $right.Ip
| extend App = strcat(L4Protocol,tostring(DestPort))
| summarize TotalBytes=sum(BytesDestToSrc+BytesSrcToDest) by App, bin(TimeGenerated, 1d)
| render columnchart
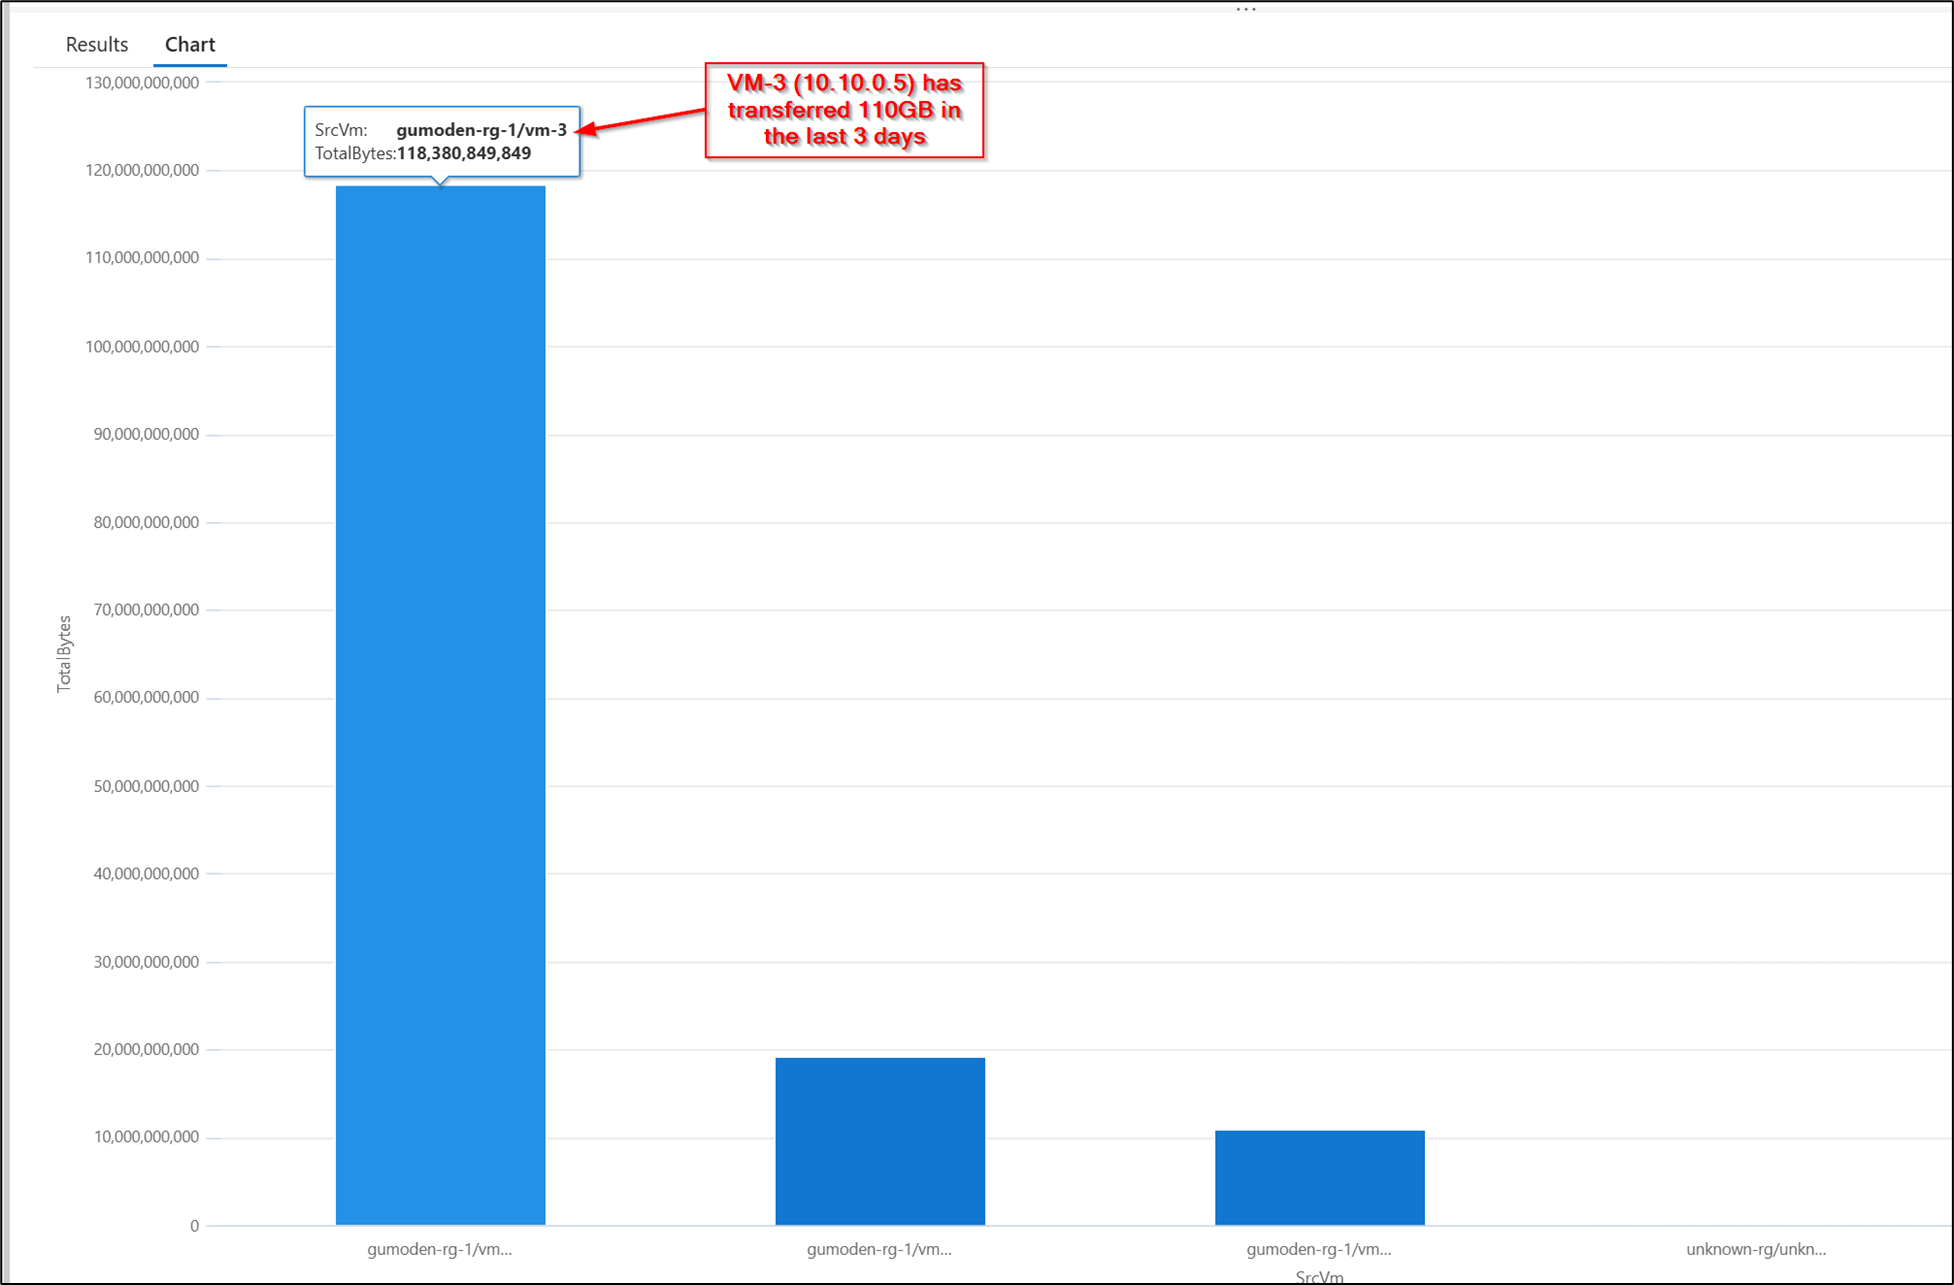
Top10 VMs based on the total data transferred
The query below is an example of a KQL query to find the Top10 VMs based on the total data transferred in the last 3 days. Note that the TotalBytes matches with the example above where the IP 10.10.0.5 had transferred 55GB to the 10.10.0.4 and another 55GB to the 10.10.0.132.
NTANetAnalytics
| where TimeGenerated > ago(3d)
| summarize TotalBytes=sum(BytesDestToSrc + BytesSrcToDest) by SrcVm
| top 10 by TotalBytes
| render columnchart
Detecting Network scans
In this section, I want to present a very simple yet powerful KQL rule that I developed to detect horizontal and vertical scans.
In the post-exploitation phase of a attack, network scanning becomes an essential activity for attackers as they move laterally within a compromised network, aiming to discover additional vulnerable systems, escalate privileges, or deepen their control. Unlike the pre-exploitation phase, where the primary focus is on finding entry points, post-exploitation scans often involve more subtle, targeted actions. Attackers may engage in both horizontal and vertical scans to gather more information about the internal network and its vulnerabilities after breaching the initial system. Detecting network scanning during the post-exploitation phase is critically important because it can provide early warning signs of lateral movement and further compromise of systems. If attackers can be identified while scanning internal networks, they may be blocked before they can expand their reach or exfiltrate data. Signs of post-exploitation scans can include unexpected connections to multiple hosts, scanning activity on unused ports, and patterns indicating attempts to enumerate network shares, credentials, or service vulnerabilities. Monitoring tools, such as Intrusion Detection Systems (IDS), Security Information and Event Management (SIEM) solutions, and network traffic analysis, are key to identifying these scans. If detected early, defenders can isolate the attacker’s movement, close vulnerabilities, and mitigate damage, preventing a more widespread breach. Therefore, timely detection and response to scanning in the post-exploitation period are essential for containing attacks and minimizing the impact.
Rule 1: Horizontal Scan Detection
NTANetAnalytics
| where TimeGenerated > ago(24h)
| where SubType == 'FlowLog'
| where ipv4_is_private(SrcIp) and ipv4_is_private(DestIp)
| where L4Protocol in ('TCP')
| where toint(DestPort) < 10000
| summarize unicDestIps = dcount(DestIp) by SrcIp, bin(FlowStartTime, 1m)
| where unicDestIps > 6
| sort by unicDestIps desc
- Purpose: This rule detects potential horizontal scans, where an attacker is scanning across multiple systems in a network. It focuses on identifying an unusually high number of unique destination IP addresses (which could represent different systems) being targeted from a single source IP.
- Explanation:
- TimeWindow: The query focuses on logs from the last 24 hours (TimeGenerated > ago(24h)), which helps to narrow down scanning activity to a relevant time frame.
- SubType ‘FlowLog’: It filters for flow logs, typically representing network traffic data.
- Private IP Range: The condition ipv4_is_private(SrcIp) and ipv4_is_private(DestIp) ensures that only private IPs within the internal network are considered, helping to focus on internal scanning rather than public internet scanning.
- Protocol and Port Filtering: The filter L4Protocol in (‘TCP’) ensures the rule only looks at TCP traffic, which is common in port scanning. DestPort < 10000 limits the scope to lower numbered ports, which often contain critical or open services.
- Summarization: The summarize function calculates the count of unique destination IPs (unicDestIps) accessed by each source IP over 1-minute intervals. If a source IP connects to more than 6 unique destination IPs within that time window (unicDestIps > 6), this is flagged as suspicious activity, potentially indicating a horizontal scan.
- What it Detects: This rule is looking for network traffic where a single source IP is connecting to multiple different devices or systems in a short amount of time, which could be indicative of an attacker scanning across the network to find accessible targets.
Rule 2: Vertical Scan Detection
NTANetAnalytics
| where TimeGenerated > ago(24h)
| where SubType == 'FlowLog'
| where ipv4_is_private(SrcIp) and ipv4_is_private(DestIp)
| where L4Protocol in ('TCP')
| where toint(DestPort) < 10000
| summarize unicDestPort = dcount(DestPort) by SrcIp, DestIp, bin(FlowStartTime, 1m)
| where unicDestPort > 3
| sort by unicDestPort desc
- Purpose: This rule is designed to detect potential vertical scans, where an attacker is focusing on a specific system and probing multiple ports on that system to identify vulnerabilities.
- Explanation
- TimeWindow: As with the first rule, this one focuses on flow logs from the last 24 hours (TimeGenerated > ago(24h)).
- SubType ‘FlowLog’: The query filters for flow logs, which contain network traffic data.
- Private IP Range: The rule restricts the analysis to private internal IPs (ipv4_is_private(SrcIp) and ipv4_is_private(DestIp)), ensuring that the scan activity is happening within the internal network.
- Protocol and Port Filtering: The rule examines only TCP traffic (L4Protocol in (‘TCP’)) and focuses on lower numbered ports (DestPort < 10000), again filtering for commonly used ports in network services.
- Summarization: Here, the summarize function counts how many unique destination ports (unicDestPort) a source IP accesses on a given destination IP over 1-minute intervals. If a source IP connects to more than 3 unique destination ports on a specific destination IP (unicDestPort > 3), this is flagged as suspicious, which may indicate that the source IP is scanning multiple ports on a single system.
- What it Detects: This rule looks for behavior where an attacker is targeting a single system (specific DestIp) and probing multiple ports on that system. It can be indicative of vertical scanning, where an attacker is trying to exploit services running on various ports on a single device.
In the post-exploitation phase, once an attacker has gained initial access, they often begin scanning the internal network to find more valuable systems, escalate privileges, or locate other points of entry. These two KQL rules help detect:
- Horizontal Scans: If an attacker is scanning across a range of systems (e.g., looking for vulnerable systems), the first rule can catch this behavior by detecting a source IP connecting to multiple different devices within a short time window.
- Vertical Scans: If an attacker is focusing on a single system and probing various ports to identify exploitable services (e.g., trying to find an open service to exploit), the second rule helps detect that activity by identifying a source IP scanning multiple ports on a single device.
By detecting these scans early in the post-exploitation phase, defenders can identify lateral movement or potential escalation attempts before the attacker can cause significant harm, such as data exfiltration or further system compromise.
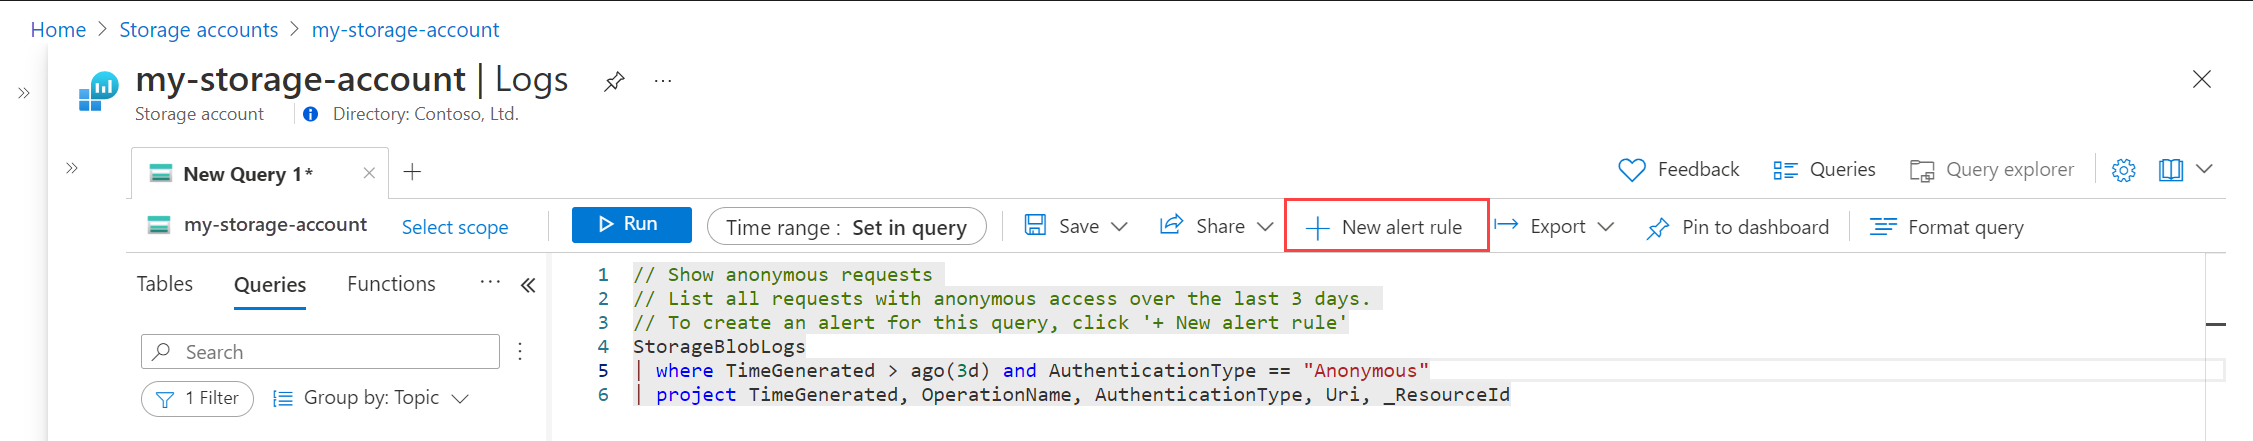
Create alert rule
In this section, you will learn how to create a log search alert for an Azure resource. Once you verify your query, you can create the alert rule. Select New alert rule to create a new alert rule based on the current log query. The Scope is already set to the current resource. You don’t need to change this value.
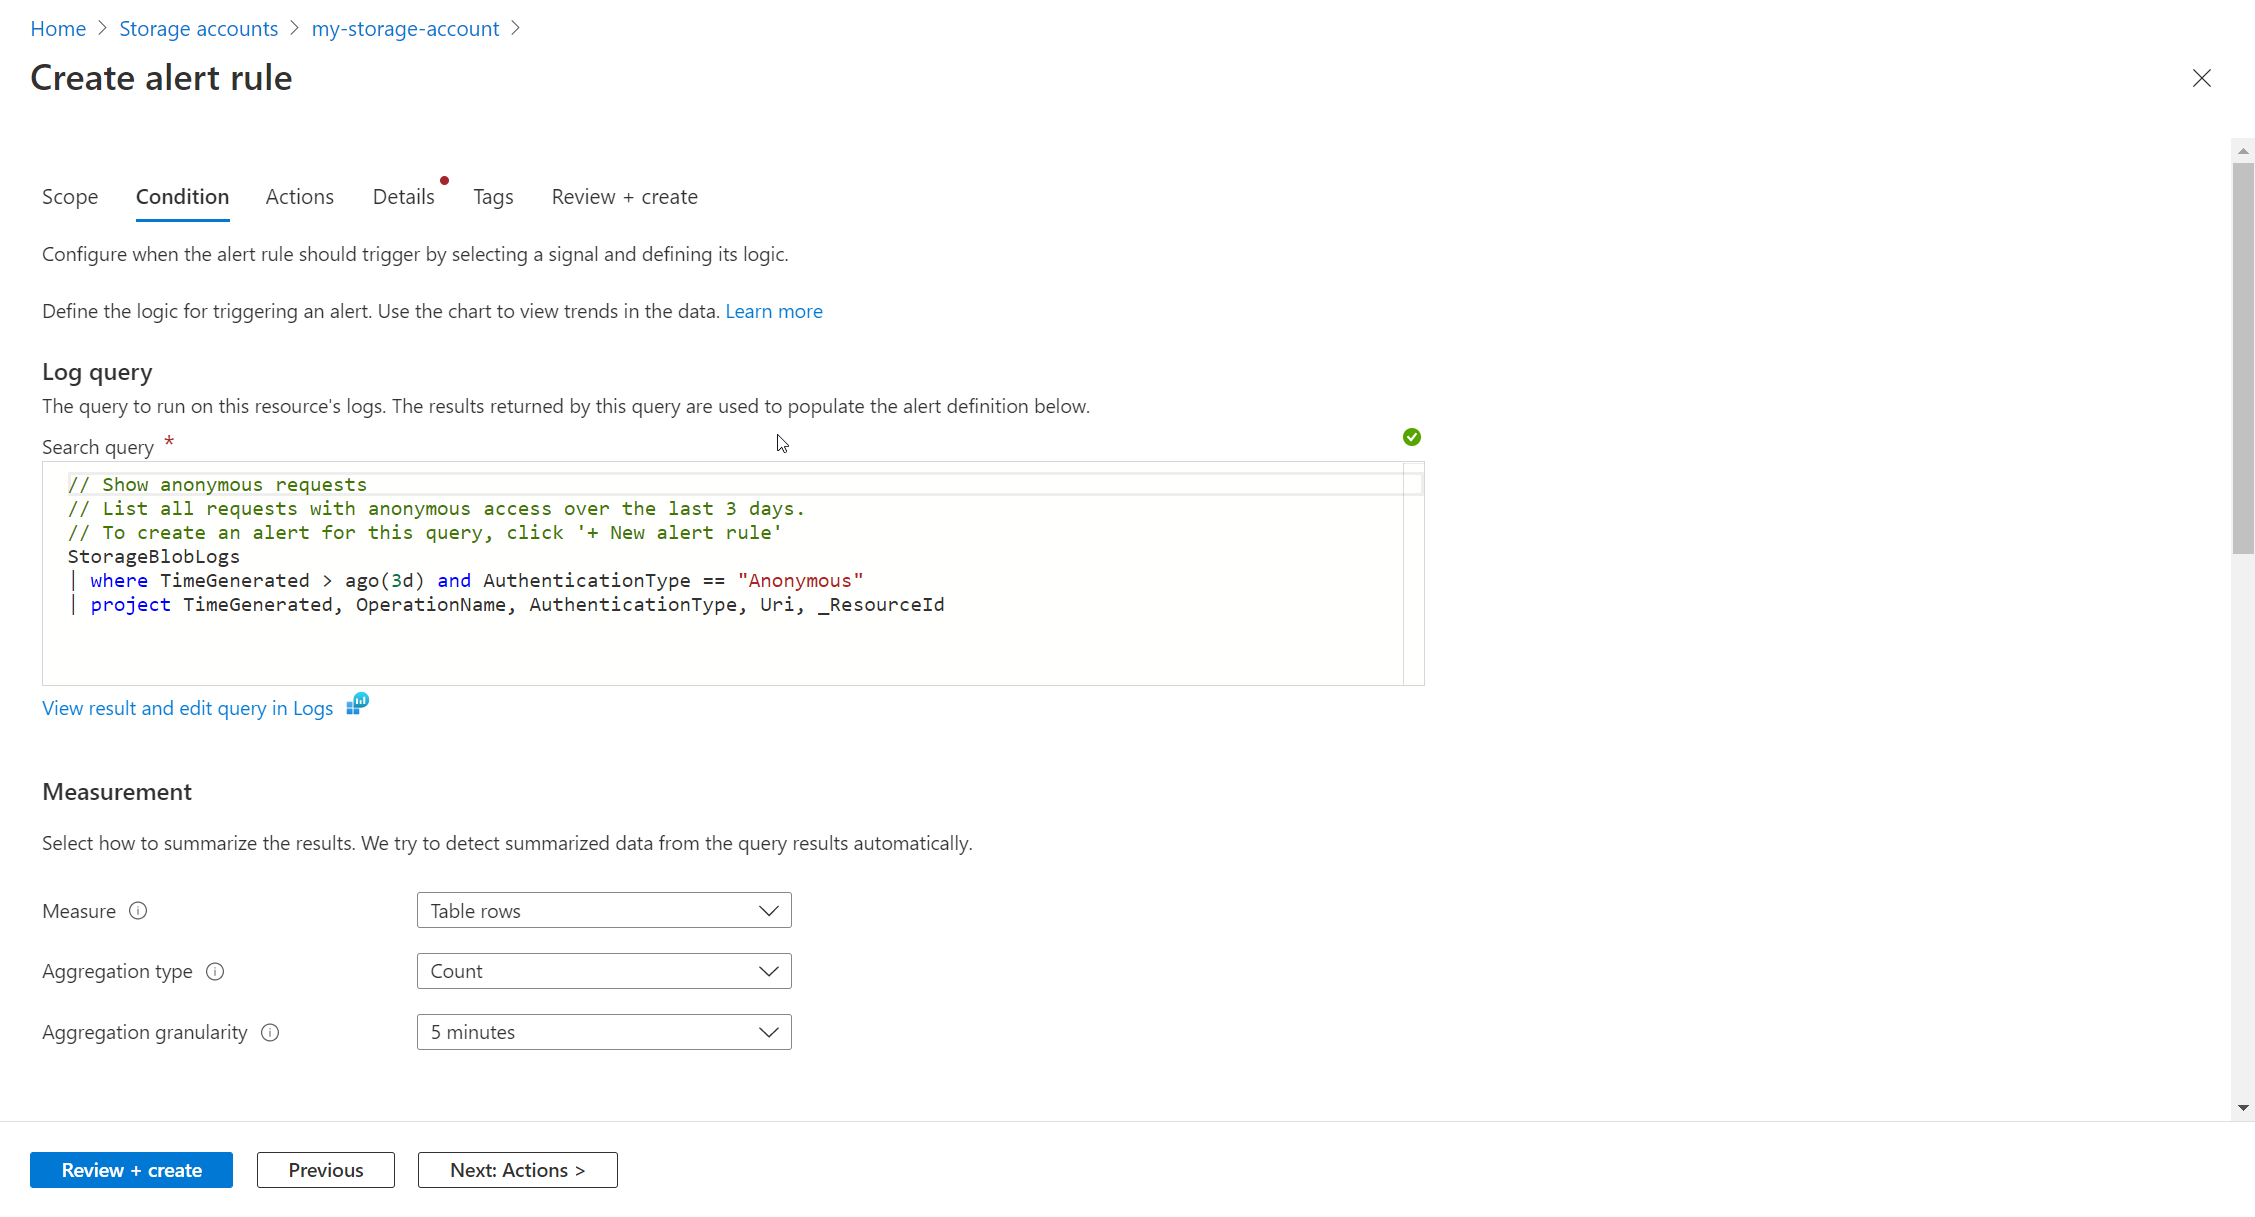
Configure condition
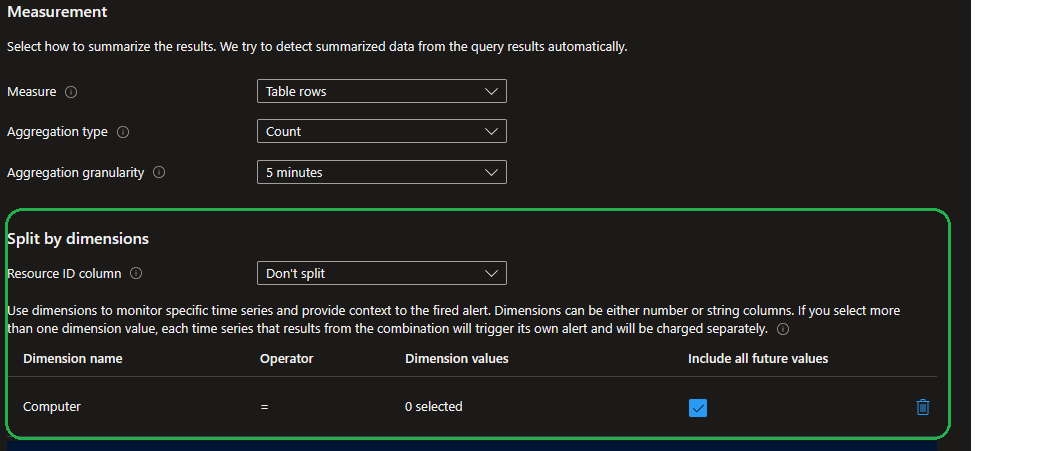
On the Condition tab, the Log query is already filled in. The Measurement section defines how the records from the log query are measured. If the query doesn’t perform a summary, then the only option is to Count the number of Table rows. If the query includes one or more summarized columns, then you have the option to use the number of Table rows or a calculation based on any of the summarized columns. Aggregation granularity defines the time interval over which the collected values are aggregated. For example, if the aggregation granularity is set to 5 minutes, the alert rule evaluates the data aggregated over the last 5 minutes. If the aggregation granularity is set to 15 minutes, the alert rule evaluates the data aggregated over the last 15 minutes. It is important to choose the right aggregation granularity for your alert rule, as it can affect the accuracy of the alert.
The combined size of all data in the log alert rule properties cannot exceed 64KB. This can be caused by too many dimensions, the query being too large, too many action groups, or a long description. When creating a large alert rule, remember to optimize these areas.
Configure dimensions
Split by dimensions allows you to create separate alerts for different resources. This setting is useful when you’re creating an alert rule that applies to multiple resources. With the scope set to a single resource, this setting typically isn’t used.
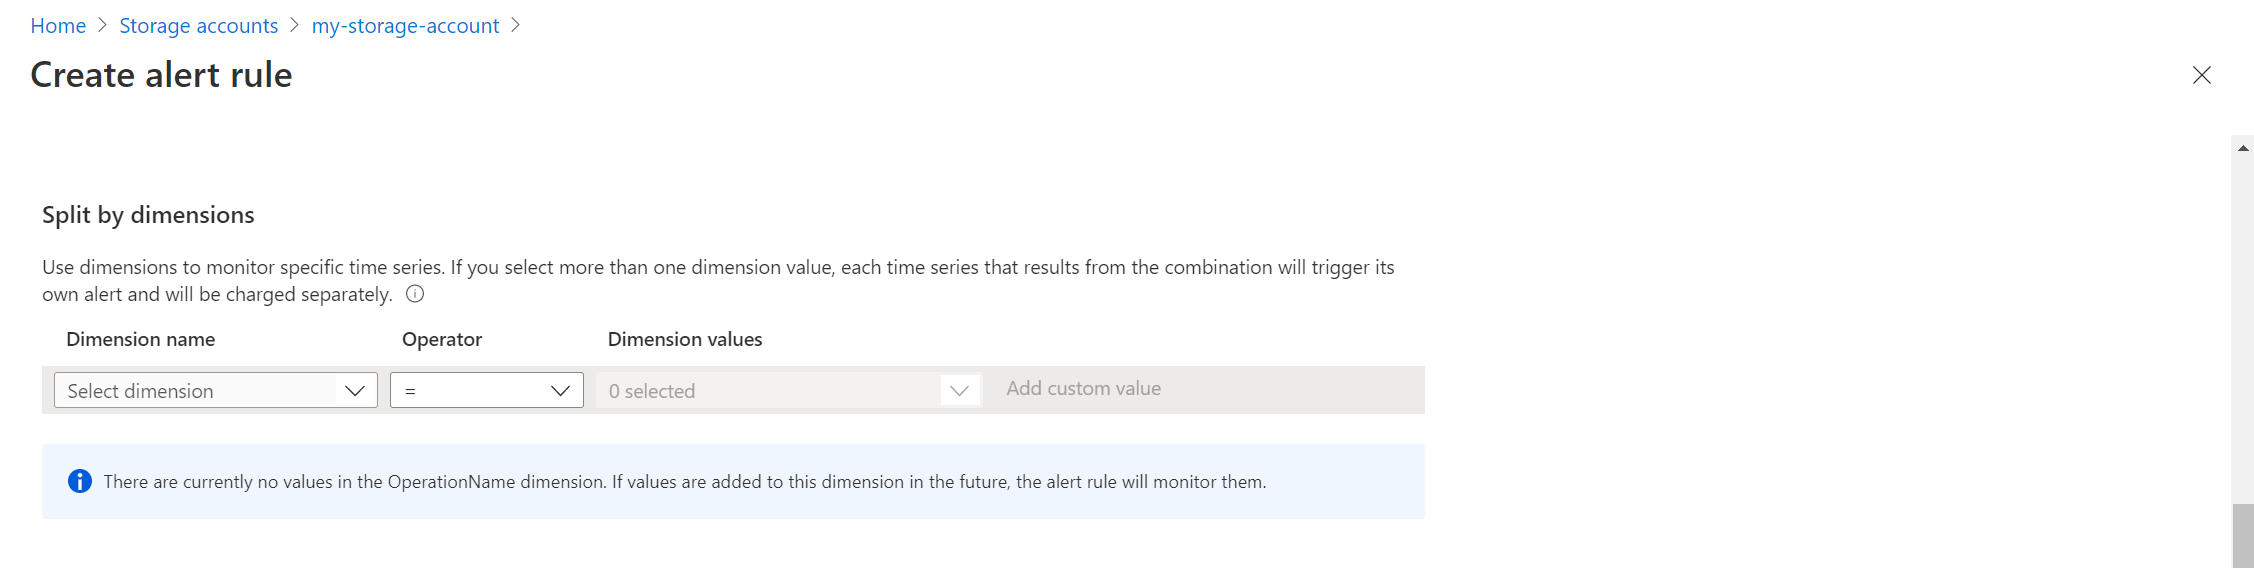
If you need certain dimensions included in the alert notification email, you can specify a dimension (for example, “Computer”), the alert notification email will include the computer name that triggered the alert. The alerting engine uses the alert query to determine the available dimensions. If you do not see the dimension you want in the drop-down list for the “Dimension name”, it is because the alert query does not expose that column in the results. You can easily add the dimensions you want by adding a Project line to your query that includes the columns you want to use. You can also use the Summarize line to add more columns to the query results.
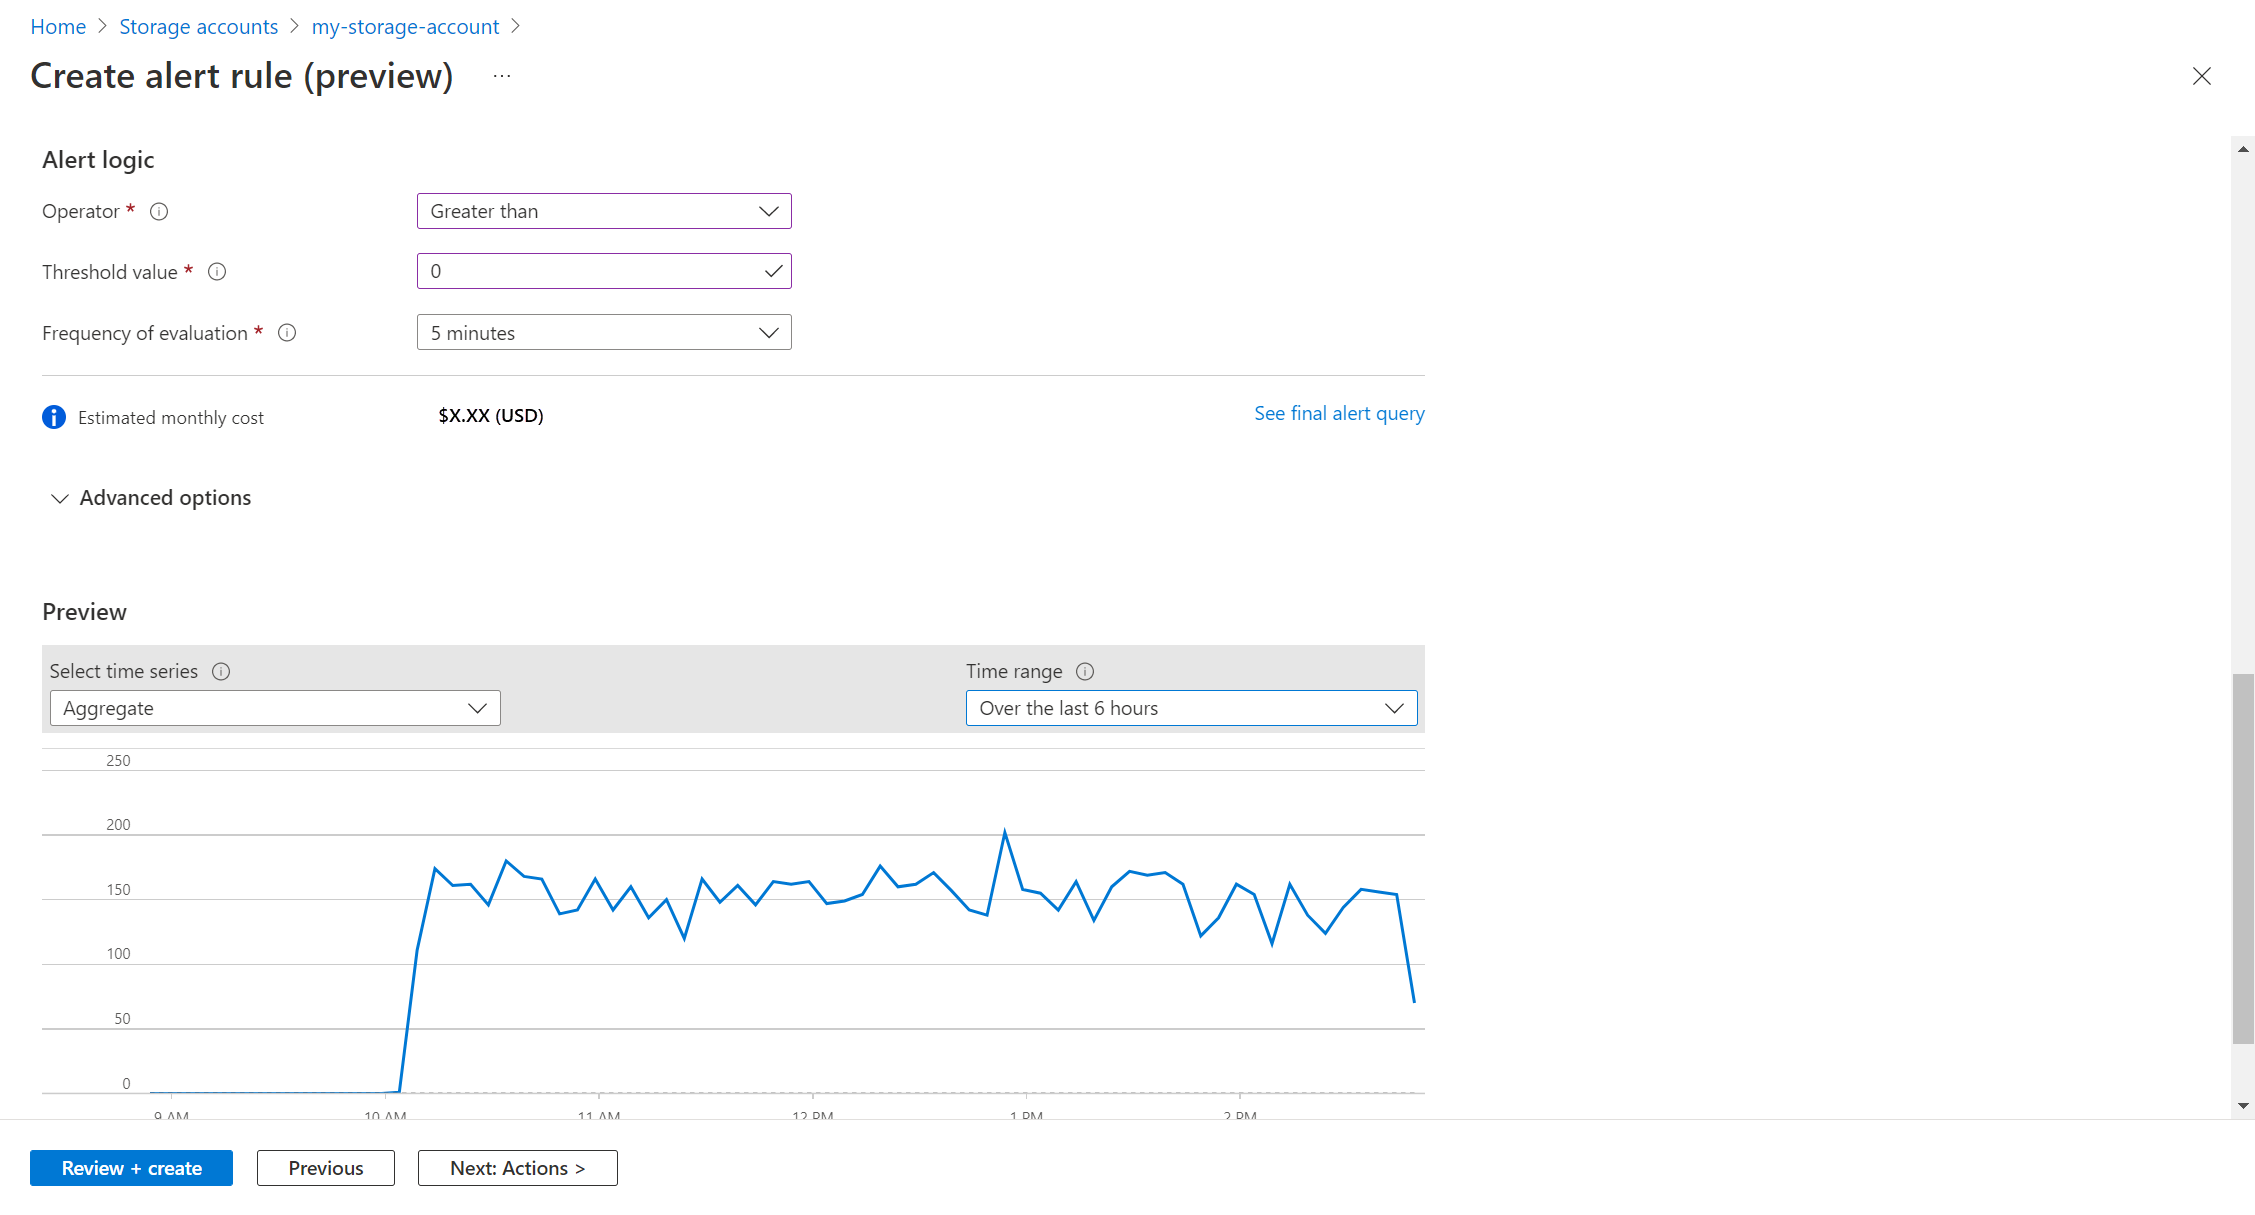
Configure alert logic
In the alert logic, configure the Operator and Threshold value to compare to the value returned from the measurement. An alert is created when this value is true. Select a value for Frequency of evaluation which defines how often the log query is run and evaluated. The cost for the alert rule increases with a lower frequency. When you select a frequency, the estimated monthly cost is displayed in addition to a preview of the query results over a time period.
For example, if the measurement is Table rows, the alert logic may be Greater than 0 indicating that at least one record was returned. If the measurement is a columns value, then the logic may need to be greater than or less than a particular threshold value. In the following example, the log query is looking for anonymous requests to a storage account. If an anonymous request is made, then we should trigger an alert. In this case, a single row returned would trigger the alert, so the alert logic should be Greater than 0.
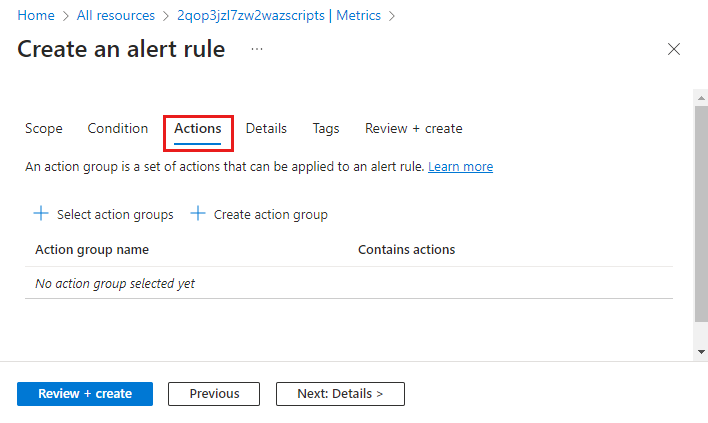
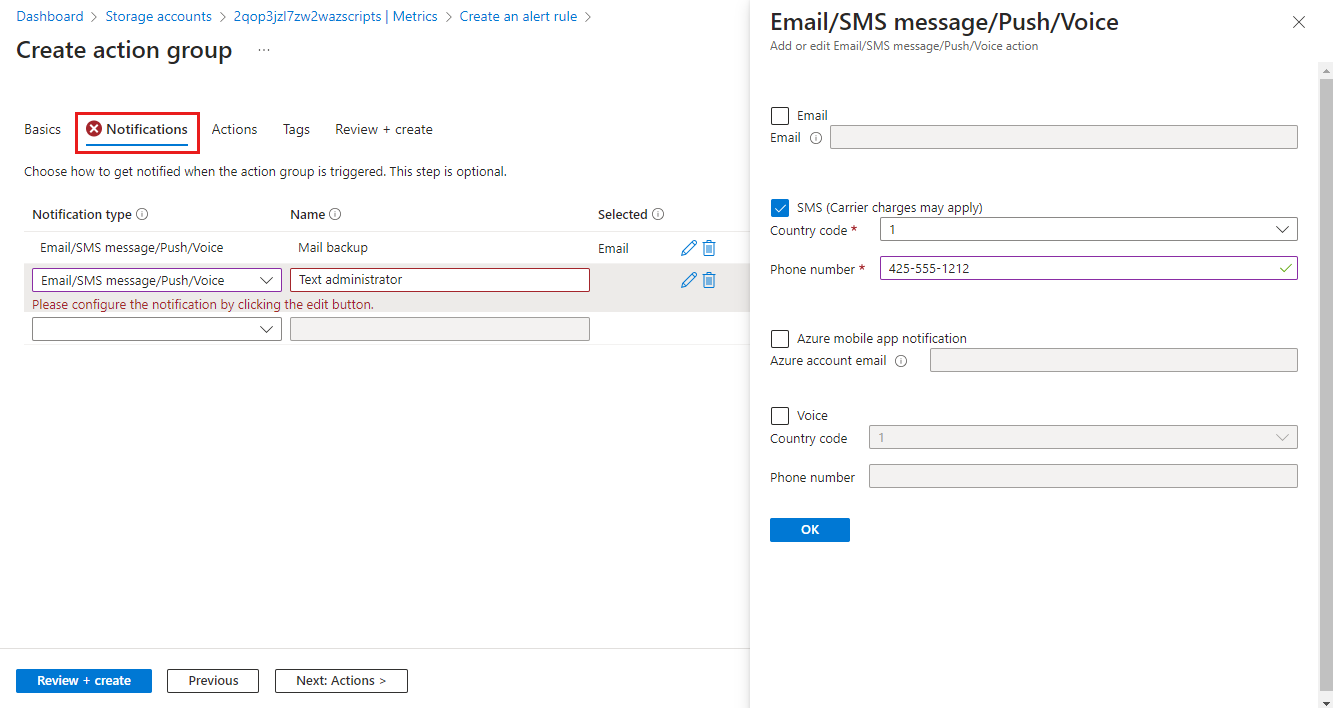
Configure actions
Action groups define a set of actions to take when an alert is fired such as sending an email or an SMS message.
To configure actions, select the Actions tab.
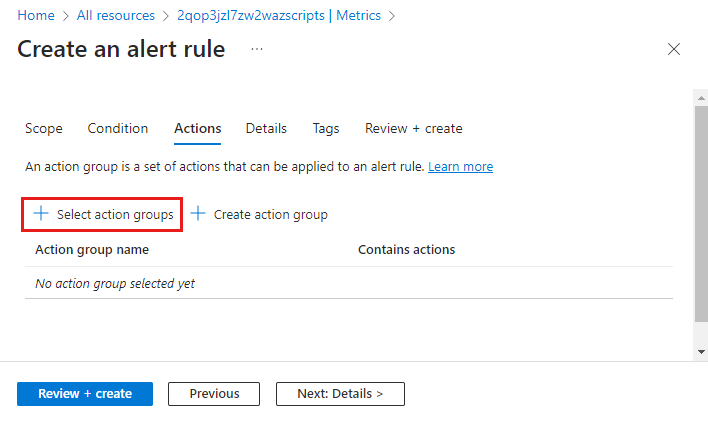
Click Select action groups to add one to the alert rule.
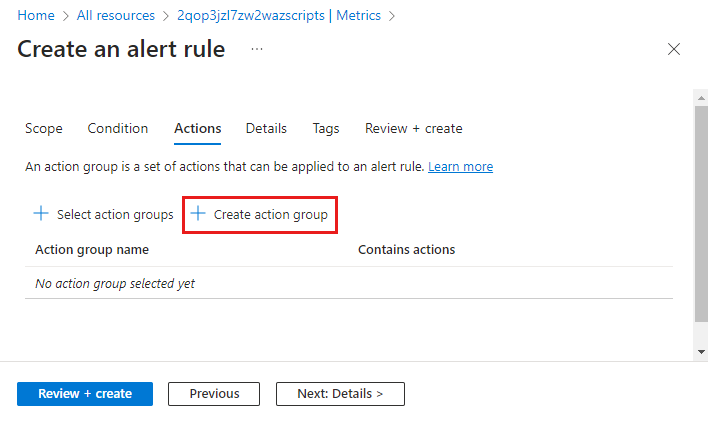
If you don’t already have an action group in your subscription to select, then click Create action group to create a new one.
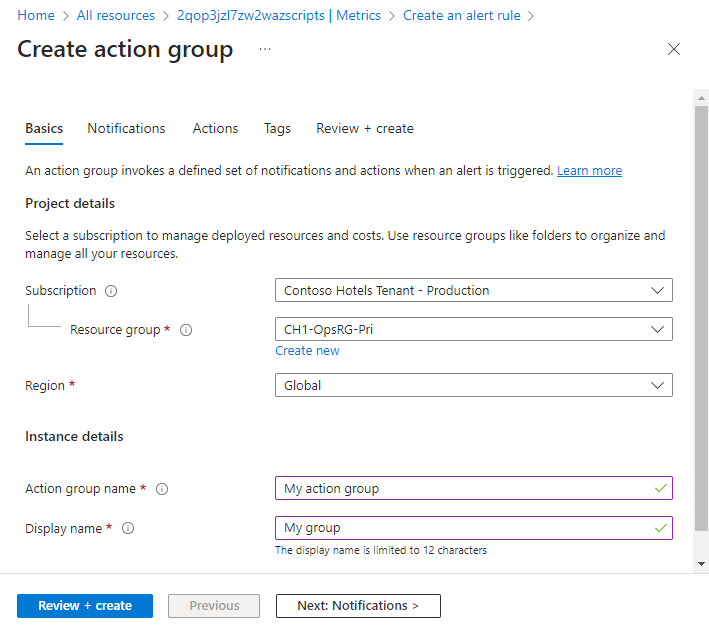
Select a Subscription and Resource group for the action group and give it an Action group name that will appear in the portal and a Display name that will appear in email and SMS notifications.
Select the Notifications tab and add one or more methods to notify appropriate people when the alert is fired.
Configure details
Select the Details tab and configure different settings for the alert rule.
- Alert rule name which should be descriptive since it will be displayed when the alert is fired.
- Optionally provide an Alert rule description that’s included in the details of the alert.
- Subscription and Resource group where the alert rule will be stored. This doesn’t need to be in the same resource group as the resource that you’re monitoring.
- Severity for the alert. The severity allows you to group alerts with a similar relative importance. A severity of Error is appropriate for an unresponsive virtual machine.
- Under Advanced options, keep the box checked to Enable upon creation.
- Under Advanced options, keep the box checked to Automatically resolve alerts. This will make the alert stateful, which means that the alert is resolved when the condition isn’t met anymore.
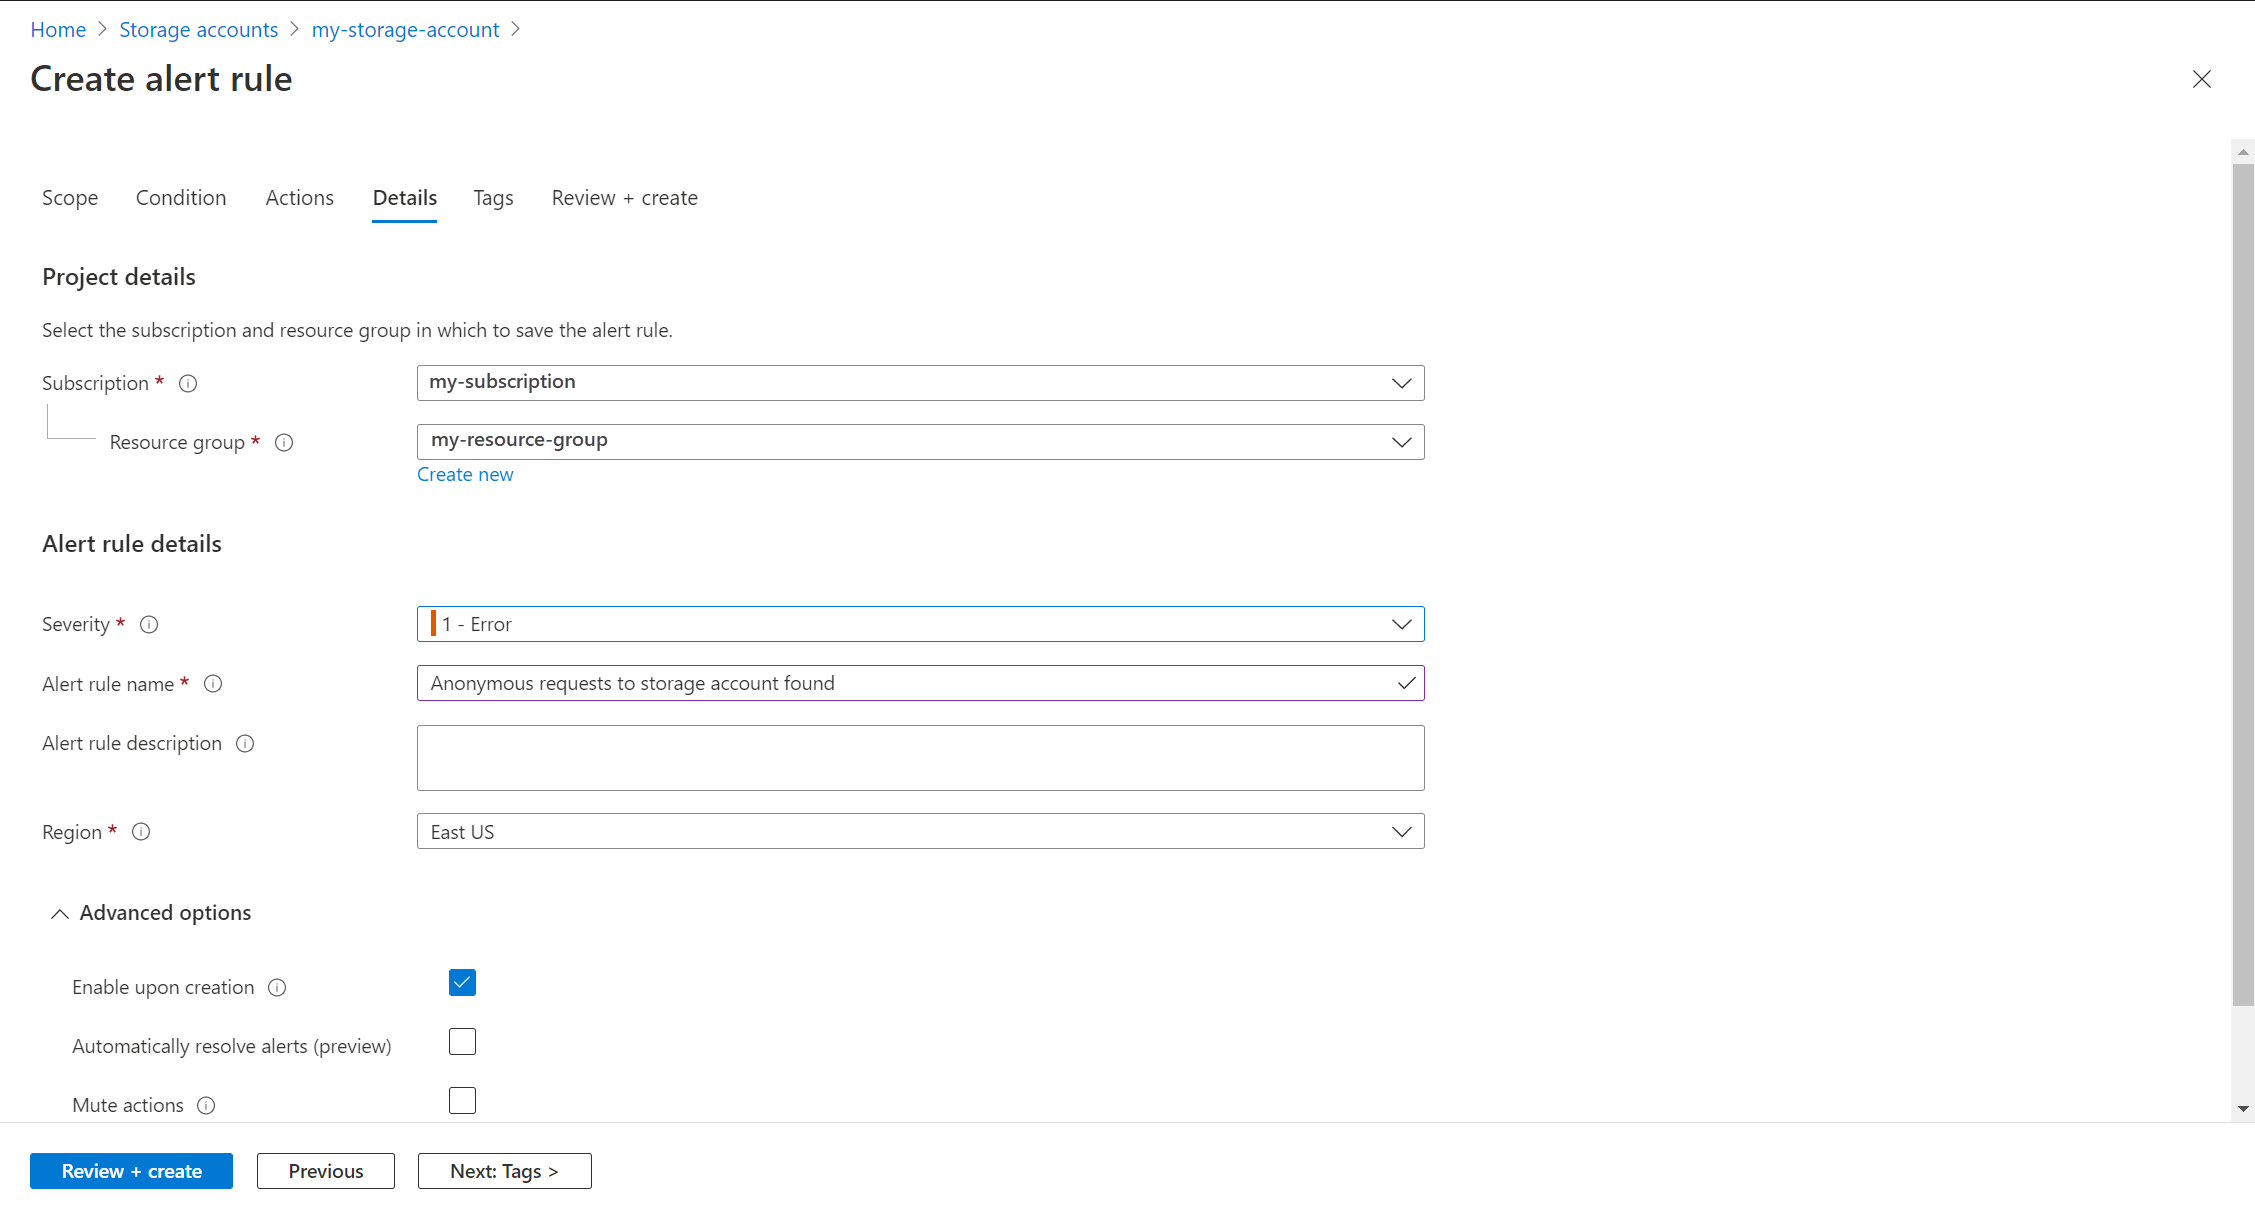
Click Create alert rule to create the alert rule.
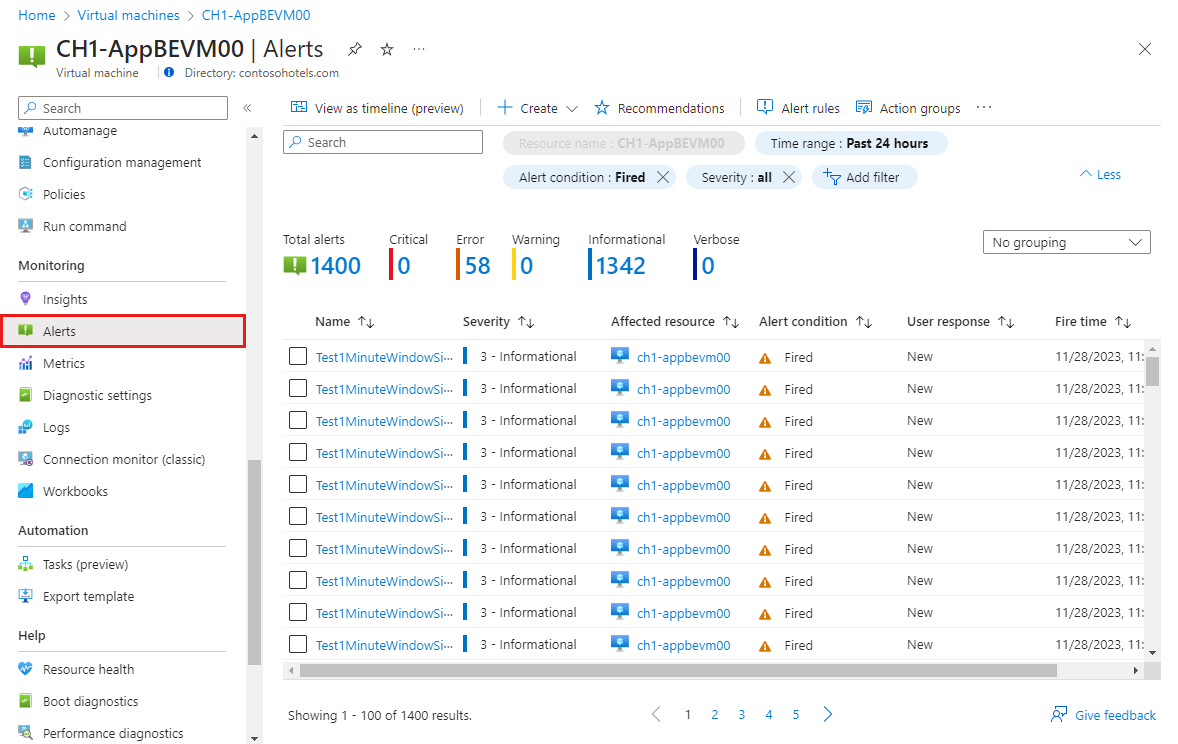
View the alert
When an alert fires, it sends any notifications in its action groups. You can also view the alert in the Azure portal.
Select Alerts from the resource’s menu. If there are any open alerts for the resources, they are included in the view.
Click on a severity to show the alerts with that severity. Select the User response and unselect Closed to view only open alerts.
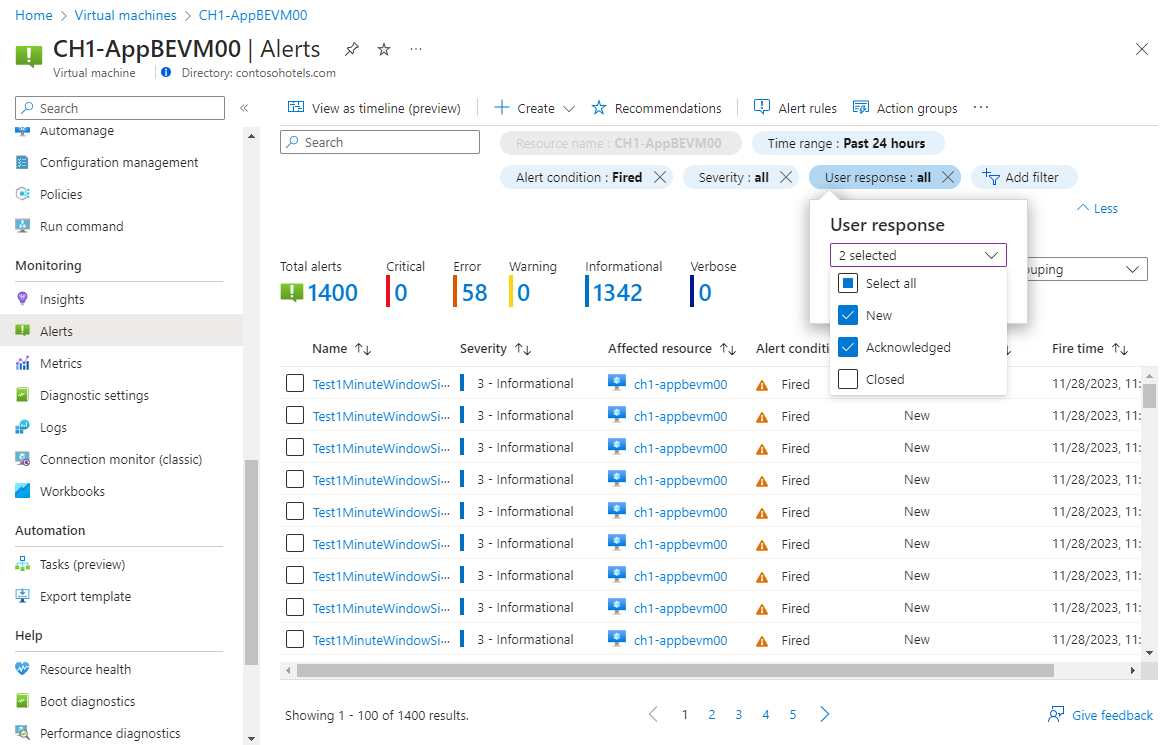
Click on the name of an alert to view its detail.
Conclusion
Detecting network scans—whether horizontal or vertical—is a fundamental aspect of securing your Azure environment. By leveraging Azure’s powerful features like VNet Flow Logs, Log Analytics, and custom KQL rules, you can proactively monitor network traffic and quickly identify potential security threats. Throughout this post, we’ve outlined the essential steps to configure flow logs, create and refine KQL queries, and set up alerting mechanisms to keep your environment secure. By implementing these recommendations, you’ll be better prepared to protect your Azure resources and ensure the ongoing health and security of your cloud infrastructure. Start applying these insights today to detect and respond to suspicious network behavior faster and more effectively..
References
- Tutorial: Create a log search alert for an Azure resource
- Create, change, enable, disable, or delete virtual network flow logs using the Azure portal
- Hub-and-spoke network topology
- Hub-spoke network topology in Azure
- Azure Network Security Ninja Training
- Network traffic observability with virtual network flow logs
- Virtual Network Flow Logs Recipes
- Monitoring traffic flows in Azure Firewall using Virtual Network Flow Logs
- Virtual Network Flow Logs and Encryption Overview
- Microsoft Azure Monitor - Alert Processing Rules